13. Client Report#
Requires Pro or Advisor. Generating a client report on the Personal plan opens the upgrade paywall.
The Client Report produces a multi-page PDF summary of a client’s retirement projection — suitable for printing, emailing, or archiving as part of a financial planning engagement. The report is fully self-contained: it includes key profile assumptions, the income projection table, embedded charts, a budget coverage analysis, and a real estate and net worth summary.
13.1 Generating a Report#
To generate a report:
- Open the client’s income chart view and make sure the desired strategy is selected.
- Click the report button in the toolbar above the chart (the document icon, to the left of the Stress Test button).
- A report options sheet appears, letting you choose which sections to include.
- Click Generate Report.
- The PDF is generated and opens automatically in Preview (or your default PDF viewer).
Report options:
The options sheet lets you toggle individual sections on or off:
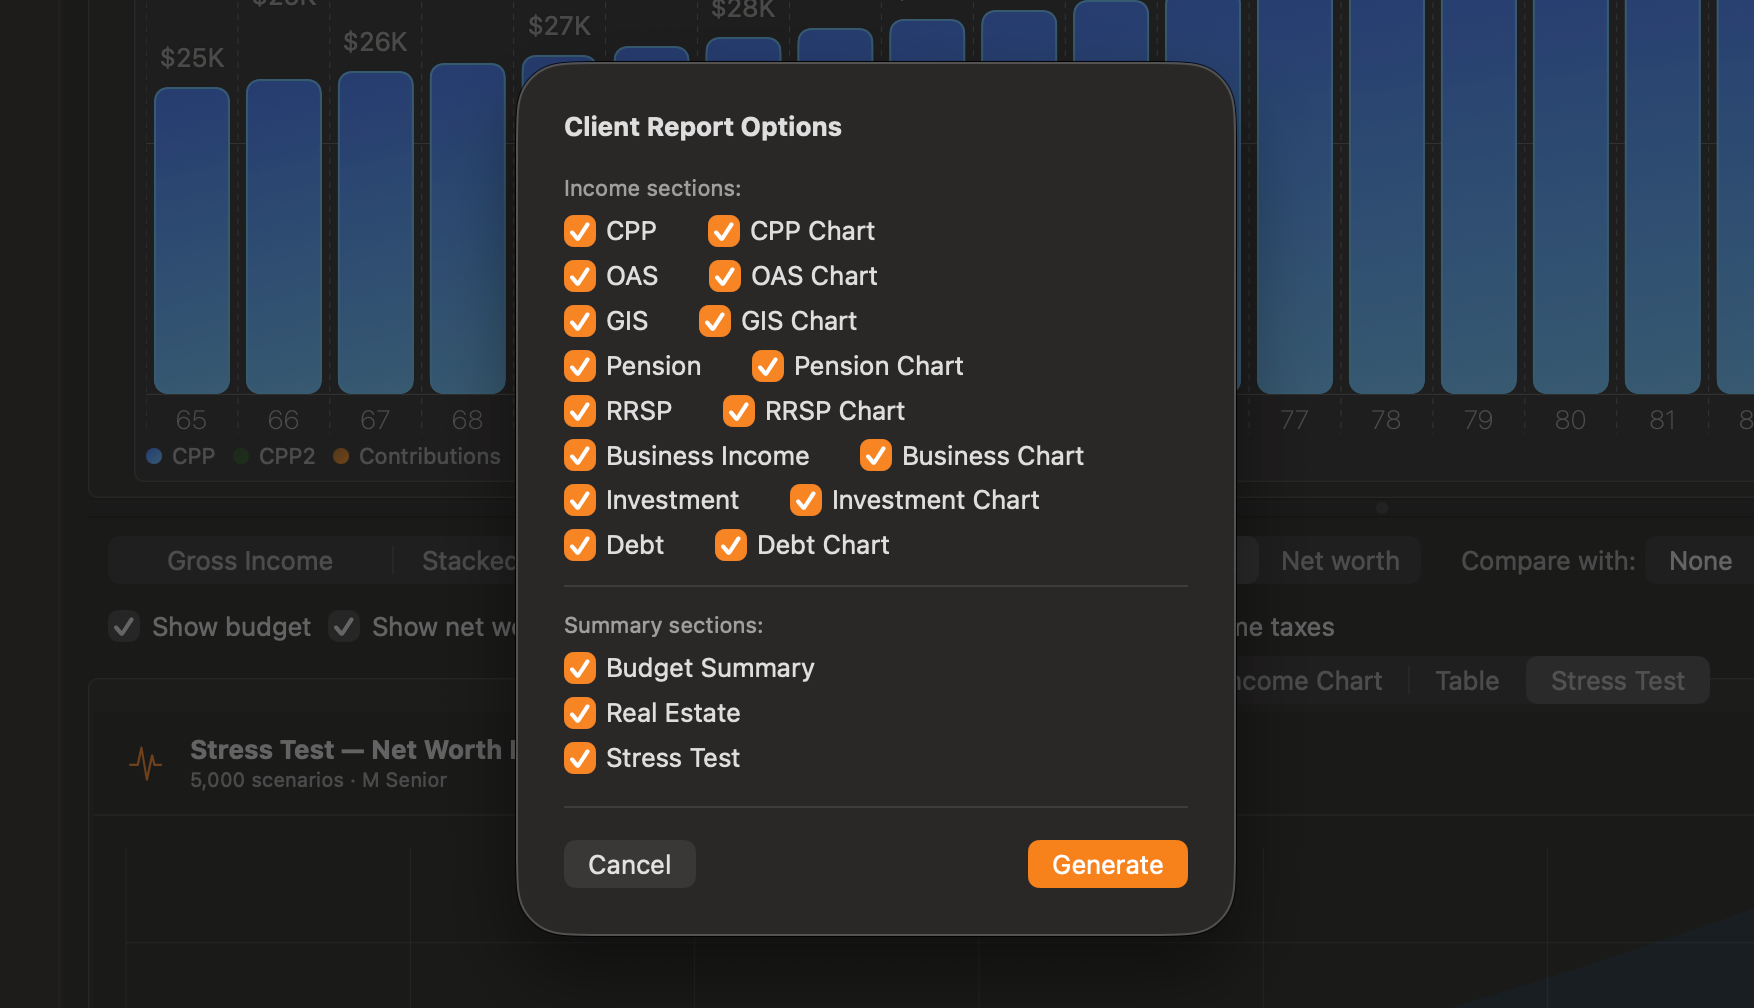
Summary sections
- Budget Summary — include or exclude the spending analysis (requires a budget to be set on the strategy)
- Real Estate & Net Worth — include or exclude the property and net worth trajectory tables (requires at least one property to be defined)
- Stress Test — include or exclude the Monte Carlo section (appears only when stress test results are available; see Section 13.3)
Income sections
Eight income sources can each be included or excluded: CPP, OAS, GIS, Pension, RRSP, Business, Investments, and Debt. Each has two independent toggles — one for its detail table and one for its chart — so you can include the year-by-year numbers without the accompanying graphic, or vice versa.
All toggles default to on and your selections are remembered between reports.
Toggle off any sections that are not relevant to this client to keep the report concise.
Household reports: If Household mode is active when you generate the report, the PDF automatically includes spouse data throughout — a combined cover page, a separate spouse profile block, household-format income tables showing both partners’ income side by side, and separate budget sections for each partner.
13.2 What the Report Contains#
The report is structured in up to five main sections, followed by optional supplemental income source sections.
Cover Page#
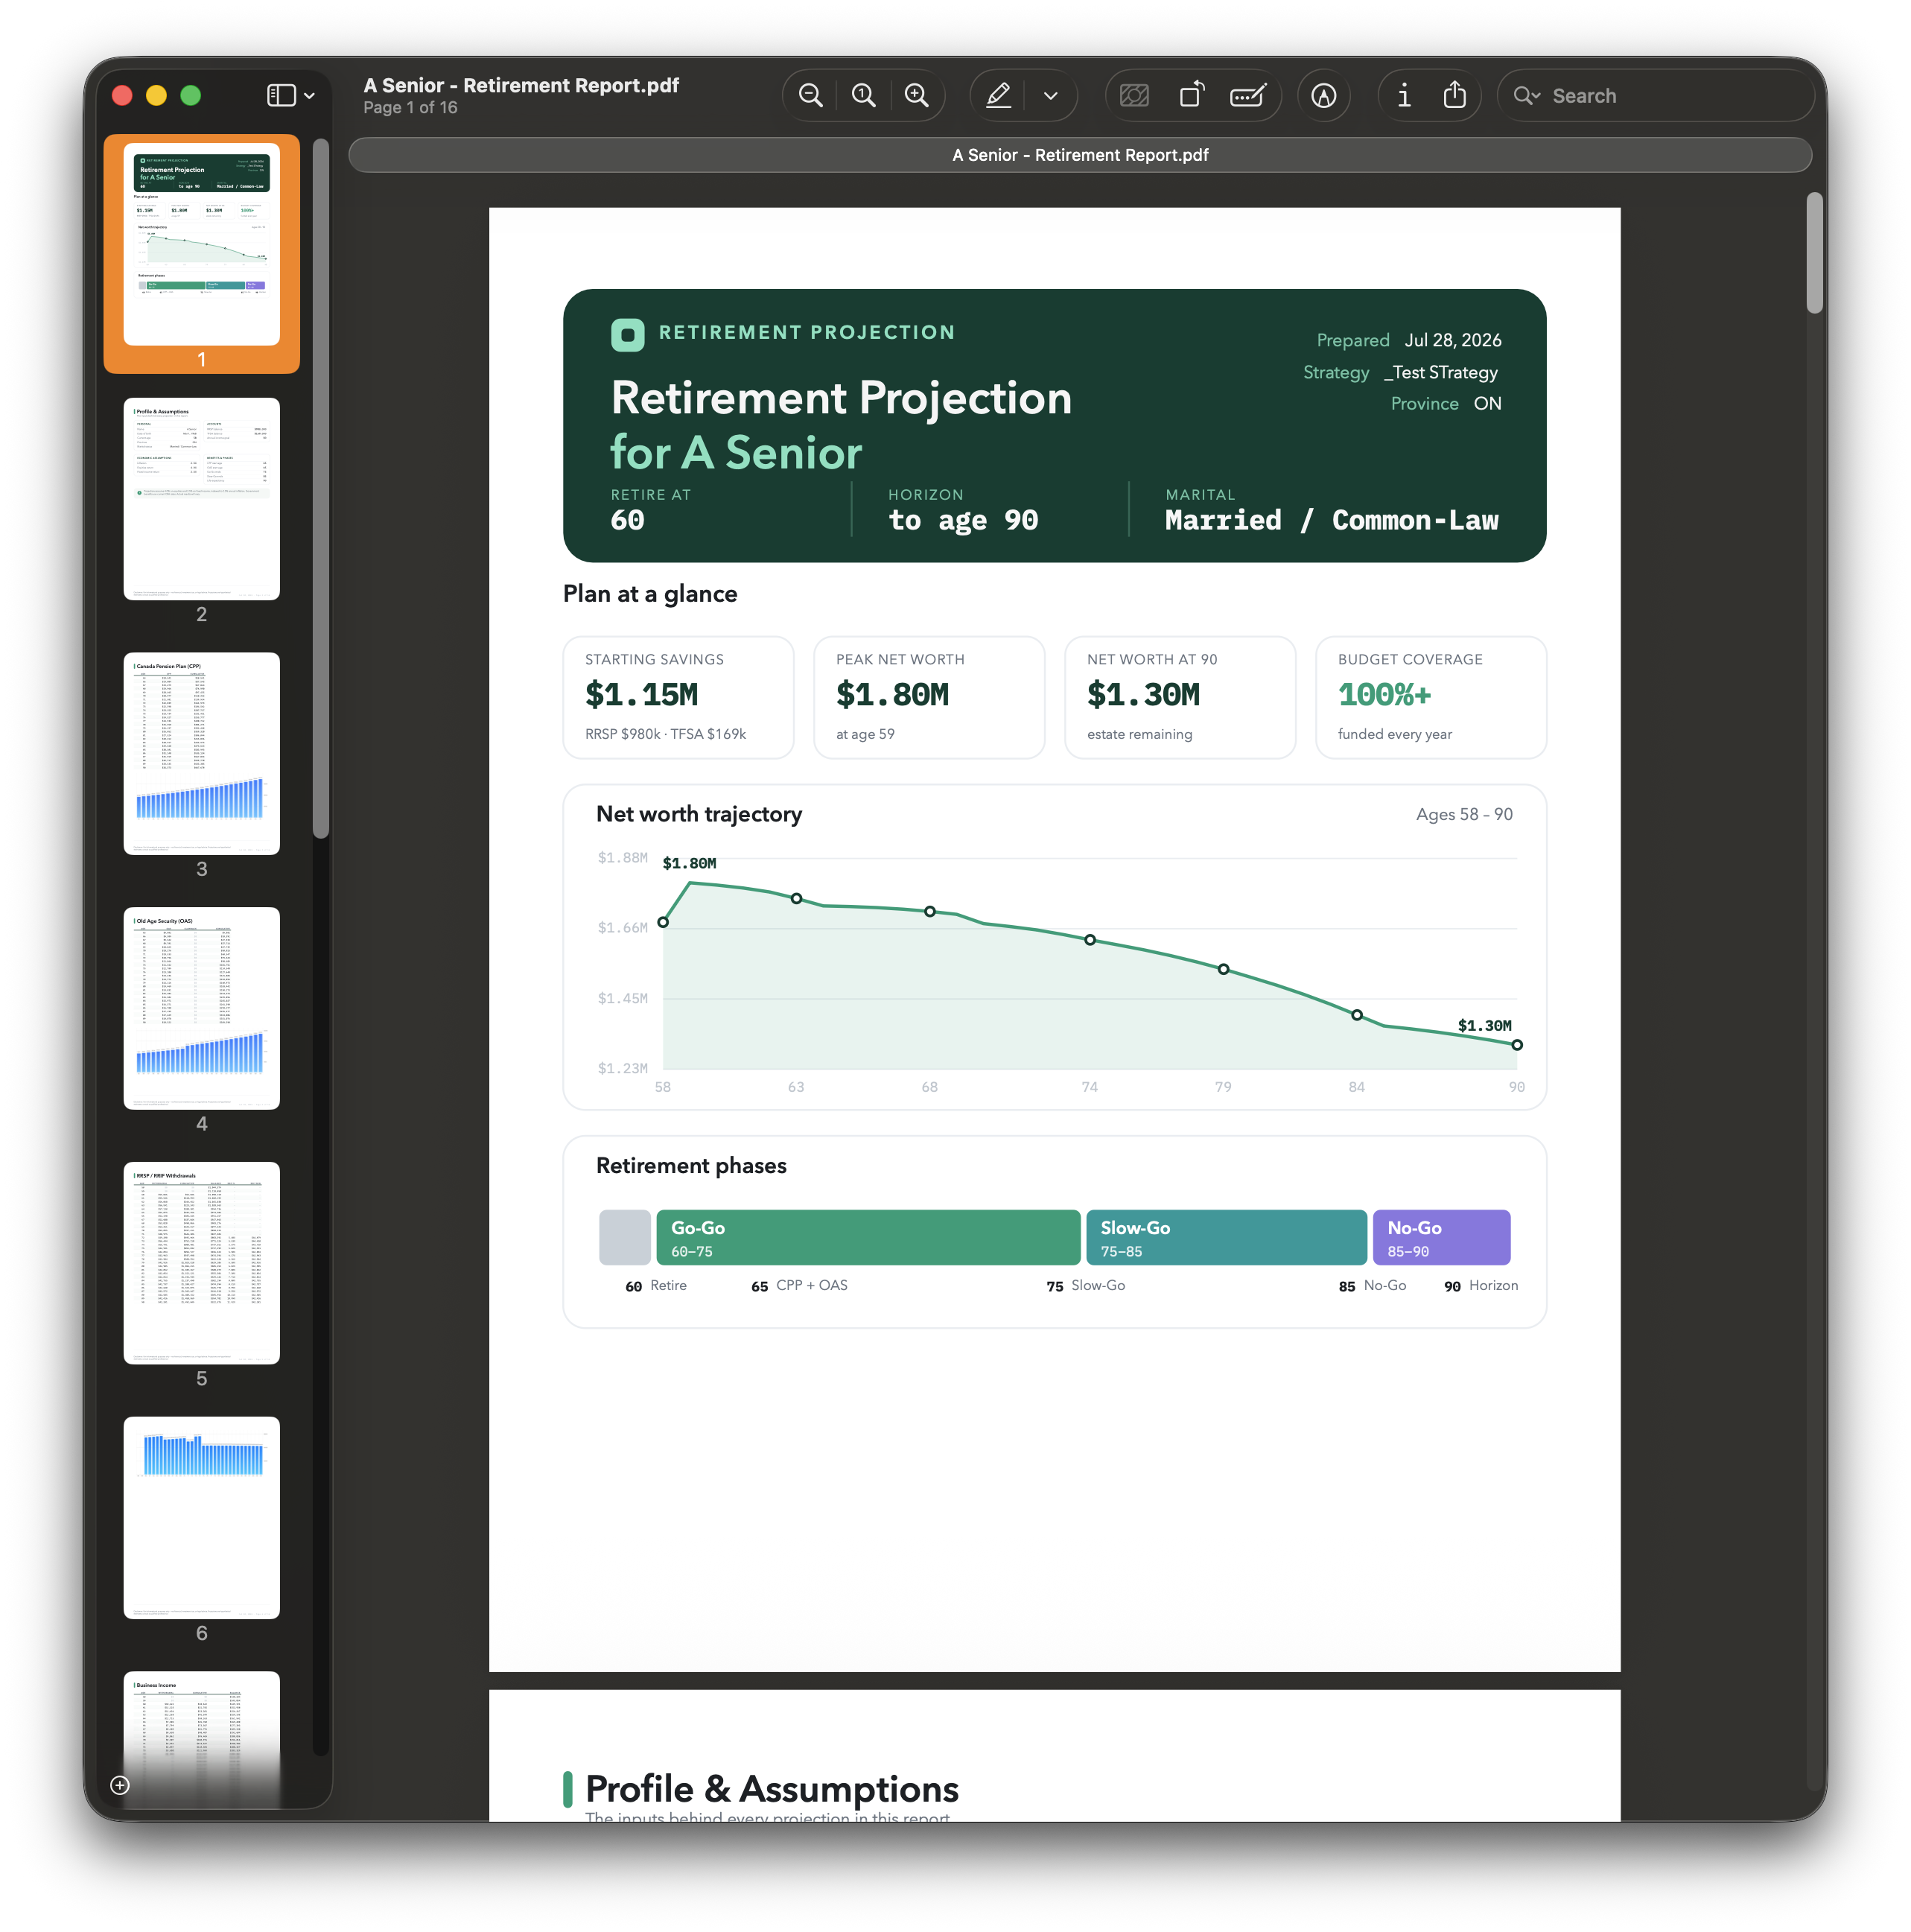
The cover page identifies the client and provides a snapshot of the key strategy assumptions at a glance.
Left column:
- Province of residence
- Retirement age
- Life expectancy
- Marital status
Right column:
- Strategy name
- Inflation assumption
- Equity return assumption
- Report generation date
In household mode, the spouse’s name appears below the primary client’s name on the cover.
A confidentiality note at the bottom reminds the reader that the report contains personal financial projections.
Profile & Assumptions#
This section documents all the key inputs behind the projection so that the basis of the analysis is clear and auditable.
Primary client block — left column:
- Full name
- Date of birth
- Current age
- Province
- Marital status
- Income goal
- RRSP balance
- TFSA balance
Primary client block — right column:
- Retirement age
- Life expectancy
- Inflation rate
- Equity return rate
- Fixed income return rate
- CPP start age
- OAS start age
- Go-Go / Slow-Go phase boundaries
In household mode, a separate Spouse Profile & Strategy block follows immediately, covering the spouse’s date of birth, current age, province, RRSP/TFSA balances, and retirement milestone ages.
Income Projections#
This is the core of the report: a year-by-year income table covering the full projection period, followed by an embedded chart.
Single-client table columns:
| Column | Description |
|---|---|
| Age | Year of projection |
| Gross | Total gross income |
| CPP | CPP income (if present) |
| OAS | OAS income (if present) |
| GIS | GIS income (if present) |
| Pension | Pension / annuity income (if present) |
| RRSP | RRSP / RRIF withdrawals (if present) |
| TFSA | TFSA withdrawals (if present) |
| Business | Business income (if present) |
| Invest. | Investment income (if present) |
| Net Income | After-tax income |
| Taxes | Estimated tax |
| Net Worth | Total asset value |
Income source columns are only included when the source has a non-zero value in at least one year.
Household table columns:
| Column | Description |
|---|---|
| Age | Primary client’s age |
| P. Gross | Primary client’s gross income |
| S. Gross | Spouse’s gross income |
| Combined | Total household gross income |
| Pns. Split | Pension split amount |
| Tax | Combined estimated tax |
| Net Income | Combined after-tax income |
| Net Worth | Combined household net worth |
Embedded chart: An after-tax income chart is rendered directly into the PDF below the table, giving a visual summary of the income trajectory across the retirement period.
Budget Summary#
The budget section appears when a budget has been entered in the strategy and the option is enabled in the report options sheet. It contains two sub-tables.
Budget items table: Lists all budget entries with their category, item name, annual amount, whether the item is essential, and the age range it applies to. In household mode, primary and spouse budget items appear in separate blocks, each with a subtotal row.
Annual coverage table: For each year from retirement to life expectancy, shows:
| Column | Description |
|---|---|
| Age | Year of projection |
| Annual Budget | The spending target for that year (inflation-adjusted) |
| Net Income | After-tax income available |
| Surplus / (Deficit) | Net income minus budget — positive means a surplus, negative is a shortfall |
| Coverage % | Net income as a percentage of the budget target |
This table makes it immediately clear in which years — if any — projected income falls short of the spending plan.
Real Estate & Net Worth#
This section summarises the property portfolio and the projected net worth trajectory. It appears when at least one property has been defined and the option is enabled.
Properties table: Lists each property with its current value, outstanding debt, net equity (value minus debt), annual appreciation rate, and the age at which the property is set to be sold (or Never if not scheduled for sale).
Net worth trajectory table: Shows total household net worth at five-year intervals from retirement to life expectancy, plus the change from the previous interval. This gives a compact long-horizon view of how the overall asset base evolves — growing, stable, or gradually depleting — alongside the spending plan.
Supplemental Income Source Sections#
When enabled in the report options, each active income source receives its own detail section with a per-year table and an embedded chart. These sections use the same layout as the main Income Projections section but focus on a single source.
Available supplemental sections: CPP, OAS (including clawback detail), GIS, Pension / Annuity, RRSP / RRIF, Business Income, Investments, Debt.
In household mode, each supplemental section shows separate sub-tables for the primary client and the spouse.
13.3 Saving and Sharing#
When the PDF generation completes, the report opens automatically in Preview (or your default PDF viewer). From there you can:
- Save to disk — use File → Save (⌘S) or File → Export as PDF to choose a destination folder.
- Print — use File → Print (⌘P) to print directly or save to PDF via the macOS print dialog.
- Share — use the Share button in the Preview toolbar to email the PDF, send via Messages, or save to Files.
- Annotate — Preview’s markup tools let you add signatures, annotations, or highlights before sharing.
The report filename defaults to [Client Name] - Retirement Report.pdf.
Tip: For client presentations, run the stress test at 5,000 iterations before generating the report. When stress test results are available, the report includes a dedicated Stress Test section showing the probability of success, the Monte Carlo fan chart, simulation inputs, and a net worth percentile table at key ages. The higher the iteration count, the more precise those results will be.
 Blue Plum Software