12. Stress Test (Monte Carlo Simulation)#
Requires Pro or Advisor subscription.
12.1 What Is a Stress Test?#
A retirement plan built on fixed assumptions — a 5% equity return every year, 2% inflation forever — will always look the same. Reality doesn’t work that way. Investment returns vary year to year, inflation fluctuates, and no one knows in advance what the actual sequence of returns will be.
A Monte Carlo stress test addresses this by running the retirement plan thousands of times, each time with slightly different return and inflation assumptions drawn at random. Rather than asking “what happens if everything goes according to plan?”, it asks “what fraction of plausible futures produce a successful outcome?”. The answer is the success rate.
How it works:
- The app takes the current strategy — all income sources, asset accounts, drawdown rules — as the baseline.
- For each simulation iteration, it draws a random set of return and inflation assumptions from a normal (bell-curve) distribution centred on the strategy’s base rates.
- The full retirement income projection is recalculated with those assumptions.
- The outcome is evaluated against the chosen success definition (net worth stays positive, or income meets budget).
- After all iterations complete, the success rate is the percentage that succeeded.
The random variation represents uncertainty about long-run average returns, not year-to-year volatility. A std dev of 3% on equity returns means the simulation tests scenarios where equities average anywhere from roughly −3% to +13% over the lifetime of the plan, reflecting genuine uncertainty about future market conditions.
Important: Monte Carlo results are hypothetical projections for planning purposes only. They do not predict the future. Consult a qualified financial professional before acting on these results.
12.2 Running a Stress Test#
Opening the settings:
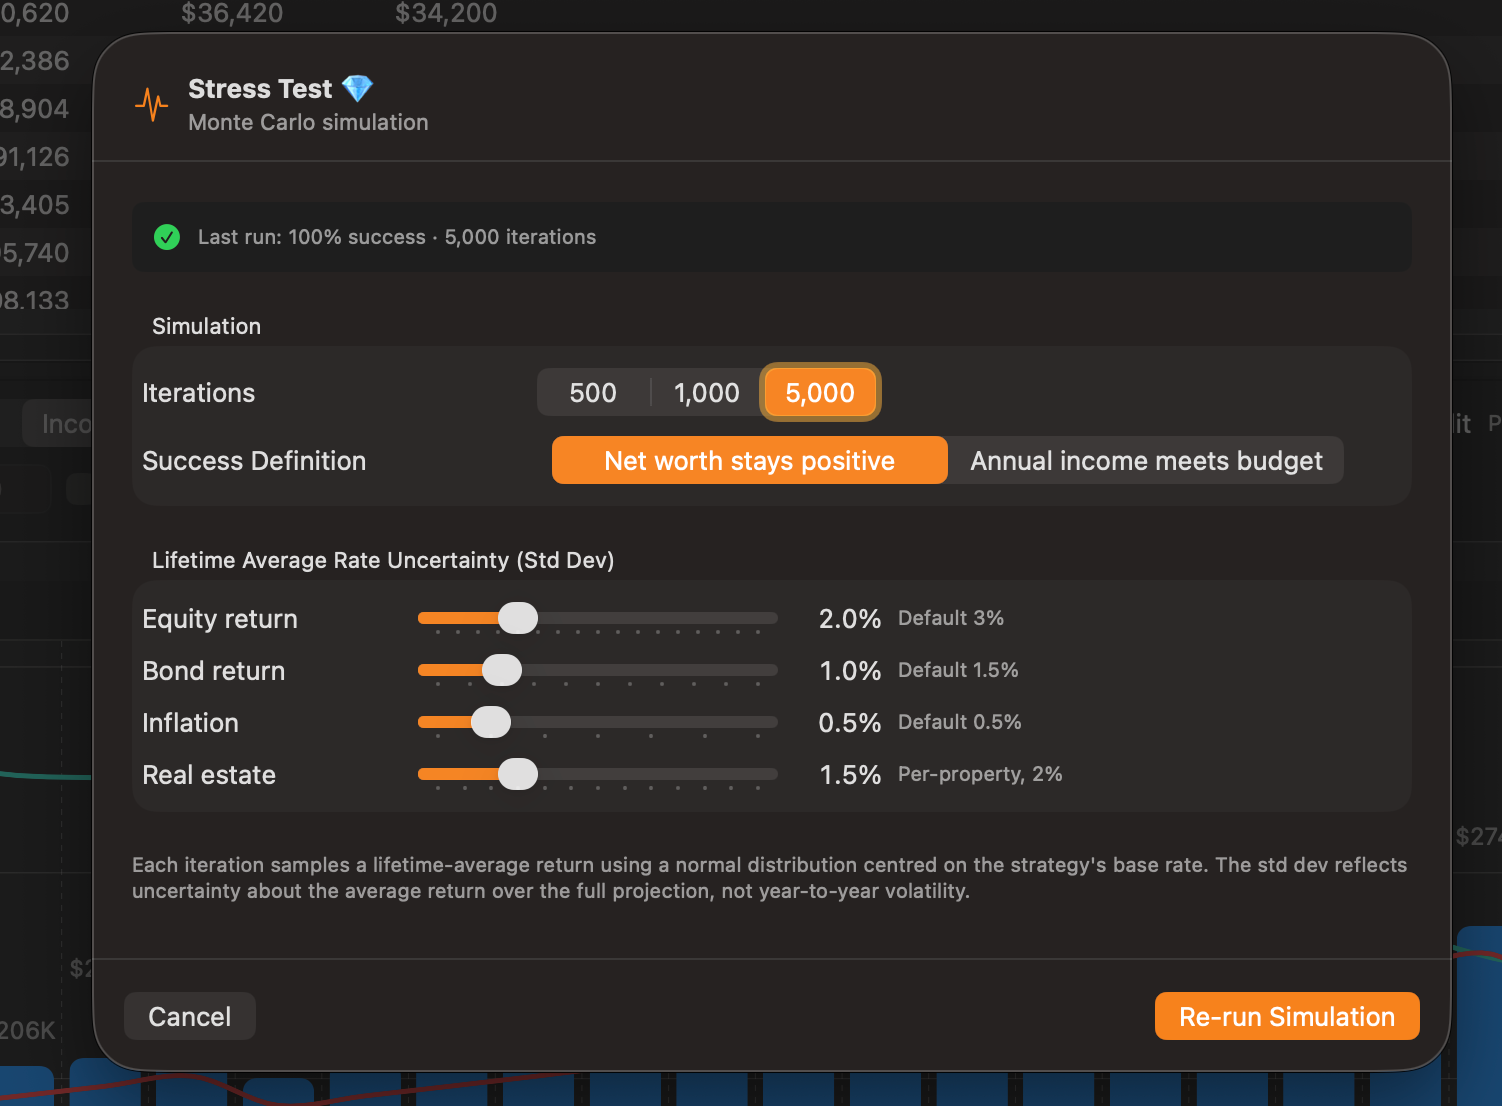
Click the Stress Test ⭐ button in the top-right corner of the income chart view. A settings sheet appears where you configure the simulation before running it.
Configuration options:
Iterations — How many times the simulation runs. More iterations produce a more statistically stable result but take longer.
| Setting | Iterations | Typical run time | Best for |
|---|---|---|---|
| Fast | 500 | < 1 second | Quick checks while editing a strategy |
| Standard | 1,000 | 1–2 seconds | Everyday planning work |
| Detailed | 5,000 | 5–10 seconds | Final client presentations, high-confidence results |
Standard deviation sliders — Control how wide the range of randomness is for each variable. A higher std dev means more extreme scenarios are tested. The defaults reflect moderate uncertainty suitable for most planning situations.
| Variable | Default | Range | What it affects |
|---|---|---|---|
| Equity Std Dev | 3.0% | 0–8% | Stocks and equity-heavy investments |
| Bond Std Dev | 1.5% | 0–5% | Fixed income and bond funds |
| Inflation Std Dev | 0.5% | 0–3% | Purchasing power erosion |
| Real Estate Std Dev | 2.0% | 0–6% | Property appreciation rate (per property) |
Setting a slider to 0% removes all randomness for that variable — every iteration will use the exact base rate from the strategy for that asset class.
Success definition — See Section 12.4 for a full explanation of the three options. The default is Net worth stays positive.
Running: Click Run Simulation. A progress indicator appears while the simulation runs in the background. The interface remains responsive; the progress label updates smoothly as iterations complete. When done, the view switches automatically to the Stress Test tab.
12.3 Reading the Results#
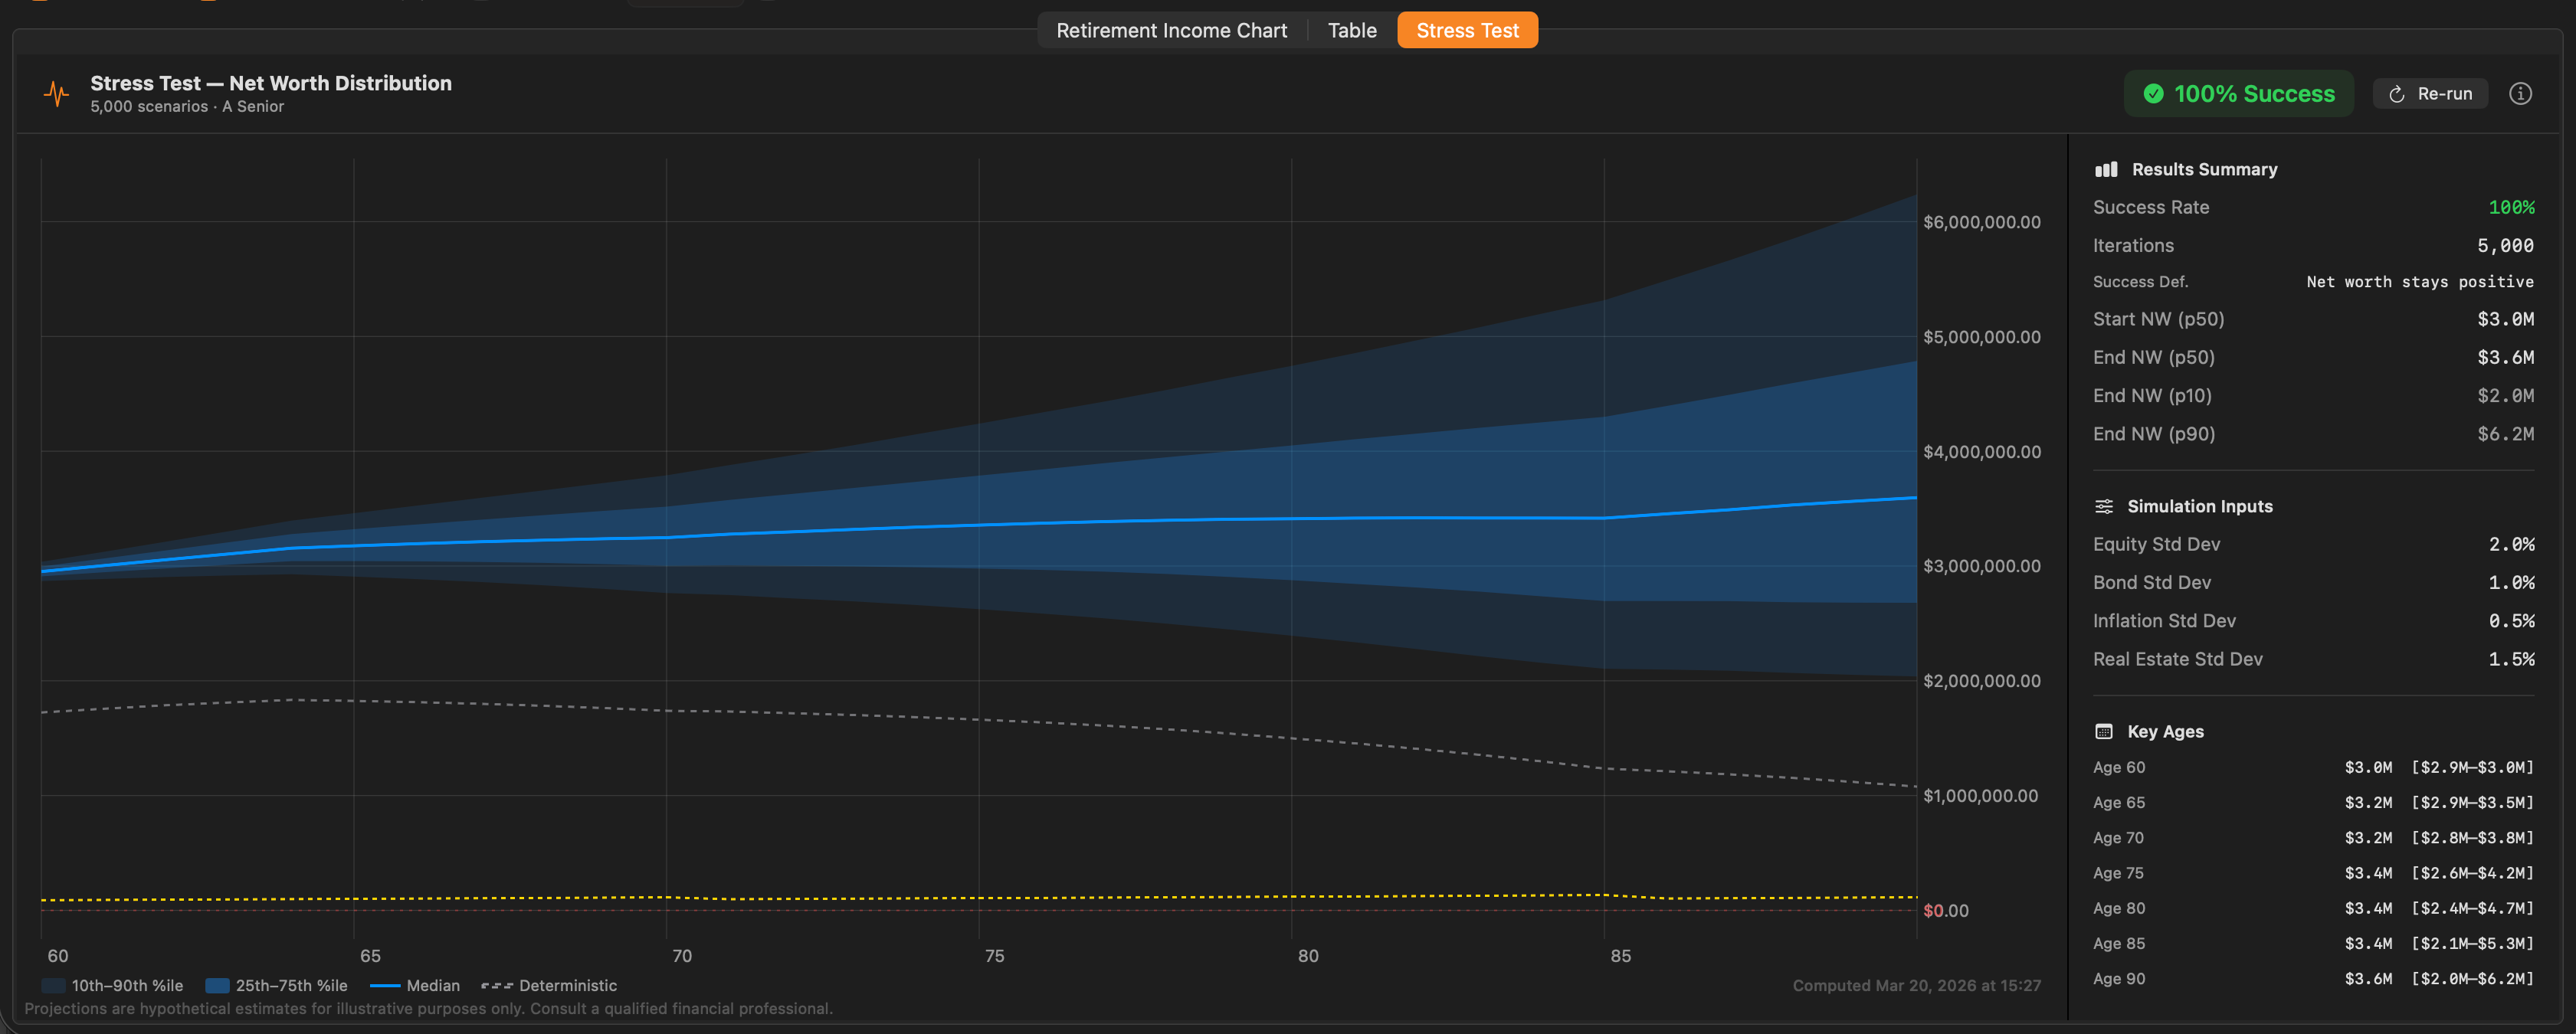
The results view is split into two panes: the fan chart on the left and the results panel on the right.
The Fan Chart#
The fan chart shows the distribution of projected net worth outcomes across all iterations, plotted by age. Instead of a single line, you see a spread of possibilities.
Reading the bands:
| Element | What it shows |
|---|---|
| Wide blue band (light) | 10th–90th percentile range — the middle 80% of all simulated outcomes |
| Narrow blue band (darker) | 25th–75th percentile range — the middle 50% of all simulated outcomes |
| Solid blue line | Median (50th percentile) — the middle outcome; half of all simulations ended above this, half below |
| Grey dashed line | Deterministic — the outcome using the exact base rates from the strategy with no randomness; this is the same projection shown in the main income chart |
| Yellow dashed line (if budget set) | Annual budget target, for visual reference |
| Red line at $0 | The zero line — any scenario where net worth falls below this is a failure under the net-worth success definition |
A wide fan means high uncertainty (large std dev settings, long time horizon, or both). A narrow fan means most scenarios produce similar outcomes. The goal is for the entire band — or at least the bottom edge of the inner band — to stay above zero through the full projection.
The Results Panel#
Results Summary:
- Success Rate — The percentage of iterations that met the success definition. Shown as a large badge, colour-coded:
- Green (85% and above) — strong plan; resilient to a wide range of scenarios
- Orange (70%–84%) — acceptable but worth reviewing; some scenarios produce shortfalls
- Red (below 70%) — plan needs attention; a significant fraction of plausible futures result in failure
- Iterations — The number of scenarios run
- Success Def. — The success definition used (e.g., Net worth stays positive)
- Start NW (p50) — Median projected net worth at the first projected age
- End NW (p50 / p10 / p90) — Median, 10th-percentile (pessimistic), and 90th-percentile (optimistic) net worth at the final projected age
Simulation Inputs — A recap of the std dev settings used for this run, so you can reproduce or compare results later.
Key Ages — A table showing the median net worth and the p10–p90 range at every five years through the projection. For example:
Age 70    $3.2M    [$2.8M – $3.8M]
Age 75    $3.4M    [$2.6M – $4.3M]
Age 80    $3.4M    [$2.4M – $4.8M]
The spread widens over time because uncertainty compounds — small differences in early returns lead to increasingly divergent outcomes decades later. A plan that looks comfortable at 70 may show meaningful downside risk by 85.
Computed timestamp — The date and time the simulation was last run is shown at the bottom of the chart.
12.4 Success Definitions#
Net worth stays positive (default)
The simulation counts an iteration as a success if projected net worth never drops below zero at any age in the plan. This is the most commonly used definition: it answers the question “does the portfolio last as long as I do?”.
Use this definition when:
- No budget has been entered in the strategy
- The primary concern is avoiding complete depletion of assets
- You want a straightforward longevity test
Annual income meets budget
The simulation counts an iteration as a success only if projected income meets or exceeds the budget target in every year of the plan. This is a stricter test: a plan can show positive net worth but still fail here if income falls below the spending target in some years.
Use this definition when:
- A budget has been entered in the strategy
- The goal is to confirm that spending needs are reliably covered, not just that assets survive
- You want to evaluate cash-flow adequacy rather than just net-worth survival
Wealth covers budget (adaptive draws)
The simulation counts an iteration as a success if wealth lasts through the end of the plan when withdrawals are sized adaptively to fund the budget each year, using the bracket-smoothing sequencer rather than the withdrawal schedule you configured.
This is the key difference from the other two definitions: it does not test the plan as you have it set up. It tests whether your assets are sufficient to fund the budget under a sensible drawdown policy. Because the adaptive draws are typically larger than a conservatively configured plan, success here is a stronger statement than Net worth stays positive — it means your wealth can fund the full budget, not merely outlast you under light withdrawals.
Use this definition when:
- You want to separate “do I have enough money?” from “is my current withdrawal plan right?”
- Your configured plan fails Annual income meets budget and you want to know whether the shortfall is an asset problem or a sequencing problem
- You are evaluating whether it is worth running Optimize Withdrawal Sequence on the strategy
Reading the three together: If Net worth stays positive succeeds but Wealth covers budget fails, your assets cannot sustain your target spending. If Wealth covers budget succeeds but Annual income meets budget fails, you have enough money — the problem is how your current plan draws it.
Note: If the income-meets-budget definition is selected but no budget has been entered in the strategy, the simulation automatically falls back to the net-worth-stays-positive definition.
12.5 Stress Test Settings and Re-running#
Adjusting settings:
After a simulation has run, the results remain saved with the strategy. To change parameters and re-run, click the Re-run button (the circular arrow icon) in the results header. This reopens the settings sheet pre-populated with the previous settings, which you can adjust before running again.
Re-running after strategy changes:
The stress test result is a snapshot — it reflects the strategy as it was when you clicked Run. If you change strategy parameters (CPP start age, RRSP drawdown, pension amount, etc.), the existing stress test result becomes stale. Re-run the simulation after making changes to get an updated result.
Choosing std dev settings:
The defaults (Equity 3%, Bond 1.5%, Inflation 0.5%, Real Estate 2%) represent moderate uncertainty suitable for most Canadian retirement plans. Consider adjusting them when:
- A client has an aggressive all-equity portfolio → increase Equity std dev to 4–5%
- A client holds primarily GICs and bonds → decrease Equity std dev, increase Bond std dev
- A client owns multiple investment properties → increase Real Estate std dev to 3–4%
- You want a conservative stress test for a client who is risk-averse → increase all sliders modestly
Tip: Run at 1,000 iterations while exploring different strategy options, then switch to 5,000 for the final version you present to a client. The higher iteration count produces a smoother fan chart and a more precise success rate.
 Blue Plum Software