7. Creating and Managing Strategies#
A strategy represents one complete retirement scenario for a client — a specific set of assumptions about contribution rates, withdrawal timing, investment returns, inflation, and spending goals. Each client can have multiple strategies, allowing you to compare outcomes side by side and answer “what if” questions.
For example, one client might have a “Conservative” strategy with a 4% equity return and a “Growth” strategy with a 6% return, or a “Retire at 60” versus “Retire at 65” comparison.
7.1 Adding, Editing, and Deleting Strategies#
Adding a strategy In the Strategy view, click the + button at the bottom of the strategy sidebar to create a new strategy. The new strategy inherits default settings and appears in the list immediately with the name “(default)”. Click the name to rename it.
Selecting a strategy Click a strategy name in the sidebar to load it. All tabs and charts update to reflect that strategy’s assumptions and projections.
Deleting a strategy Right-click a strategy name in the sidebar and choose Delete, or select it and click the trash button.
Subscription limits: Personal subscribers can have 1 strategy per client, Pro subscribers up to 2, and Advisor subscribers unlimited. See Section 3 — Subscription Plans.
7.2 Strategy Settings Bar#
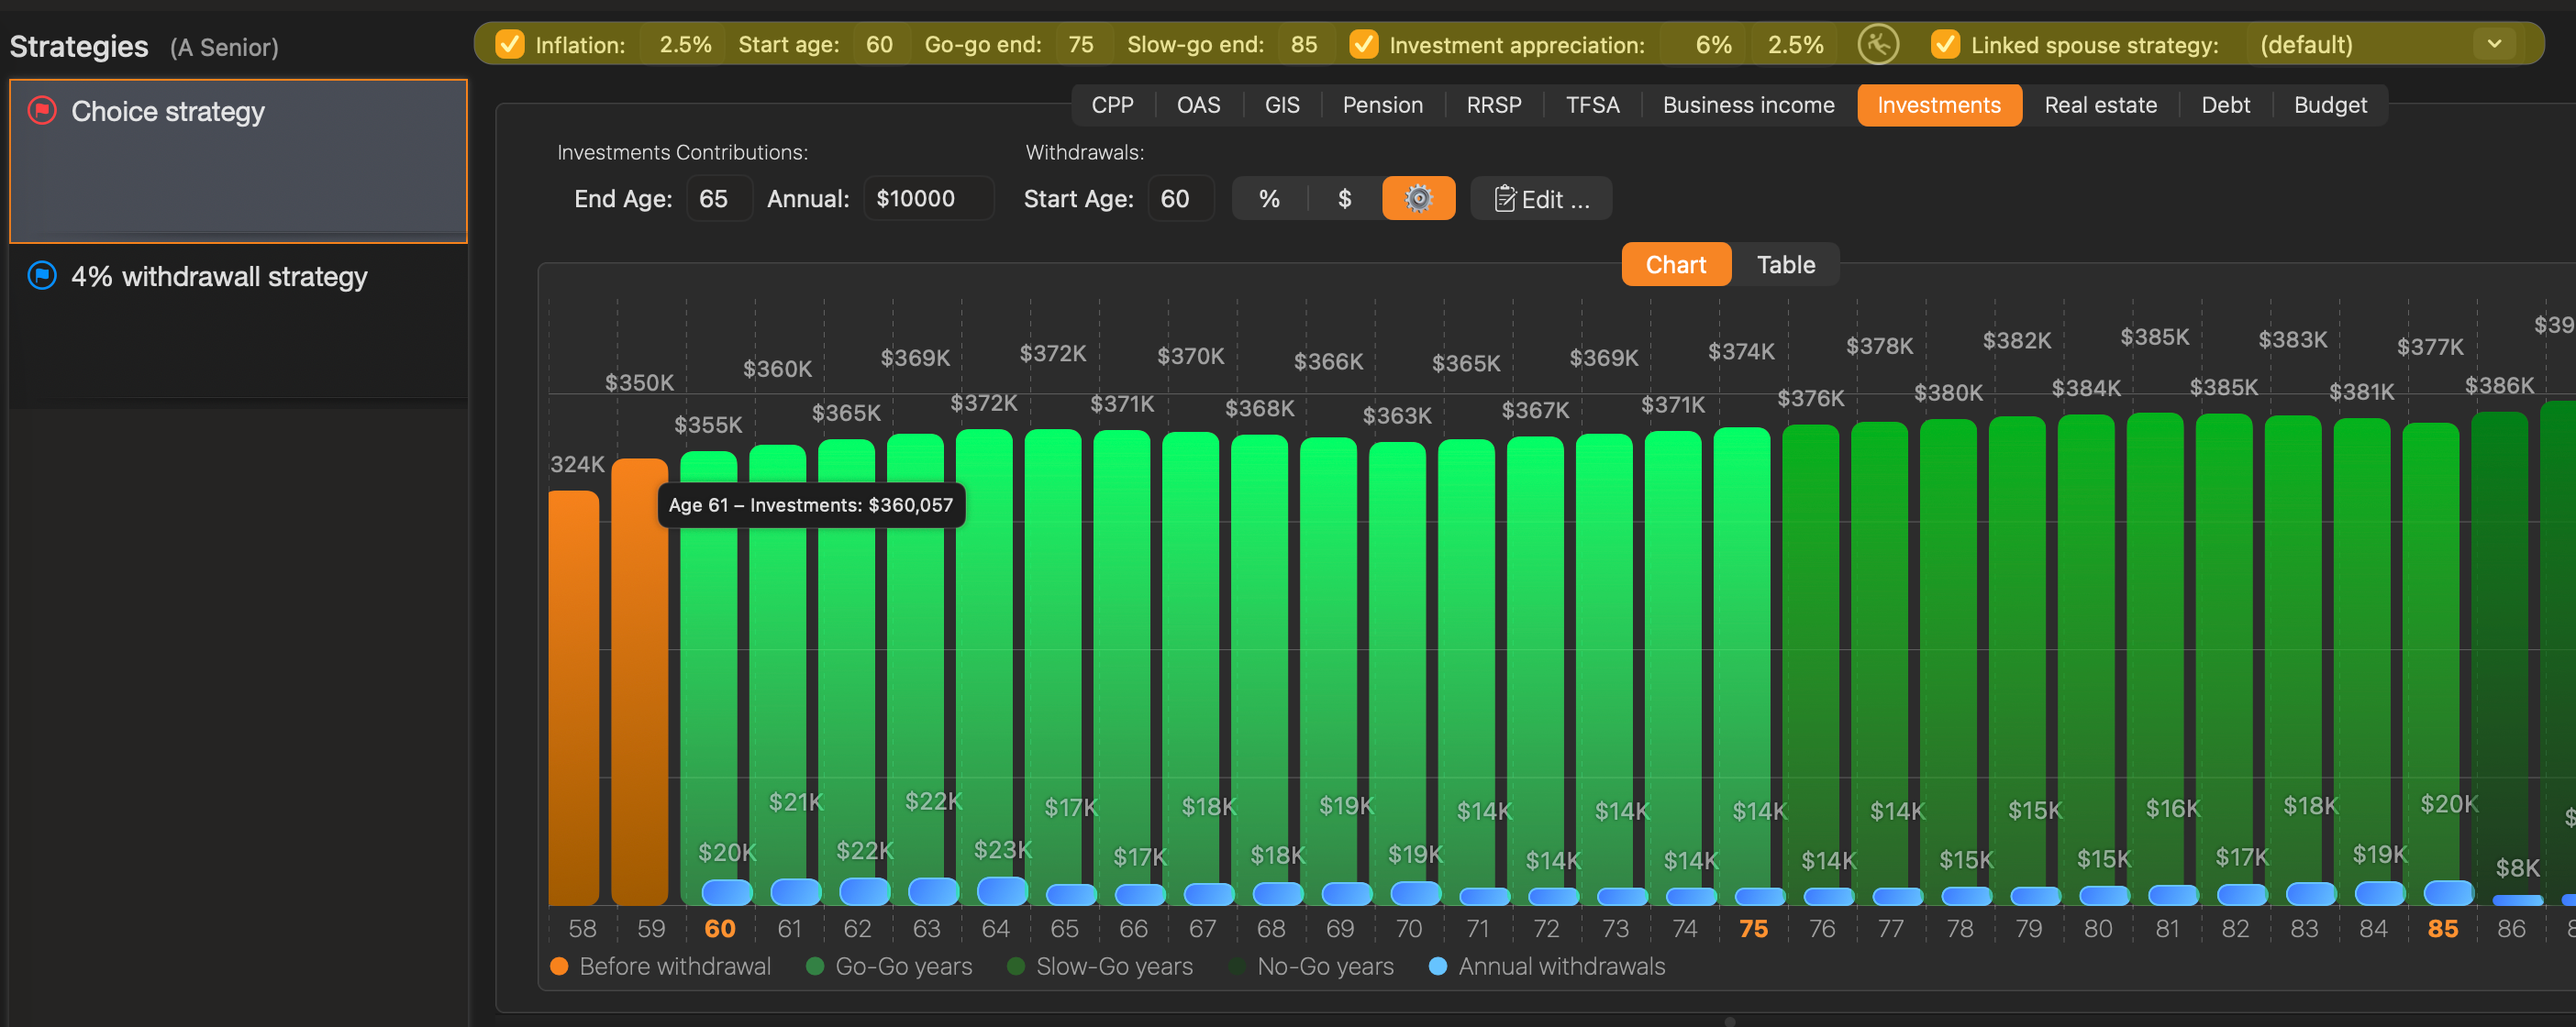
The settings bar along the top of the strategy view contains the global parameters that drive all projections for this strategy. Changes take effect immediately and all charts recalculate in real time.
Inflation The assumed annual rate of general price increases, expressed as a percentage. When the inflation-adjustment toggle (the green checkbox to the left) is on, all income amounts in the projection are expressed in real (today’s) dollars, adjusted for purchasing power. A typical value is 2–2.5%.
Start age The retirement start age — the age at which the client stops working and begins drawing from retirement income sources. All projections begin at this age.
Go-go end The age at which the Go-Go phase of retirement ends and the Slow-Go phase begins. During Go-Go years, discretionary spending is typically at its highest. A common value is 75.
Slow-go end The age at which the Slow-Go phase ends and the No-Go phase begins. During Slow-Go years, spending tends to moderate. A common value is 85. From this age forward, the No-Go rates apply through to the expected age.
The three-phase model: The Go-Go / Slow-Go / No-Go framework divides retirement into three spending stages. Withdrawal amounts for RRSP, TFSA, Business Income, and Investments can be set independently for each phase, allowing you to model the typical pattern of decreasing discretionary spending over the course of retirement.
Investment appreciation Two values separated by a space: the assumed annual return for equities (first value) and bonds/cash (second value). These rates are applied to all investment accounts (RRSP, TFSA, Business, non-registered Investments) according to each account’s stock-vs-bonds allocation percentage.
Clock icon Toggles the inflation-adjustment mode on or off.
Linked spouse strategy A dropdown that selects which of the spouse client’s strategies is used when Household Mode is active. This ensures the correct spouse scenario is paired for pension income splitting and combined projections. See Section 9 — Household Mode.
7.3 Income Source Tabs#
The strategy view contains a tab bar with the following tabs: CPP, OAS, GIS, Pension, RRSP, TFSA, Business income, Investments, Real estate, Debt, and Budget. Each tab shows the projected values for that income source as a chart and/or table, along with controls to adjust the strategy-specific settings for that source.
Most tabs include a Chart / Table toggle. Some also offer Annual / Cumulative and Total / Stacked display options.
The charts use a consistent colour scheme for tabs that include the three-phase withdrawal model:
- Orange bars — years before withdrawals begin (accumulation phase)
- Green bars — Go-Go withdrawal years
- Light green bars — Slow-Go withdrawal years
- Pale green bars — No-Go withdrawal years
- Blue bars — annual withdrawal amounts (overlaid on the balance bars)
7.4 CPP#
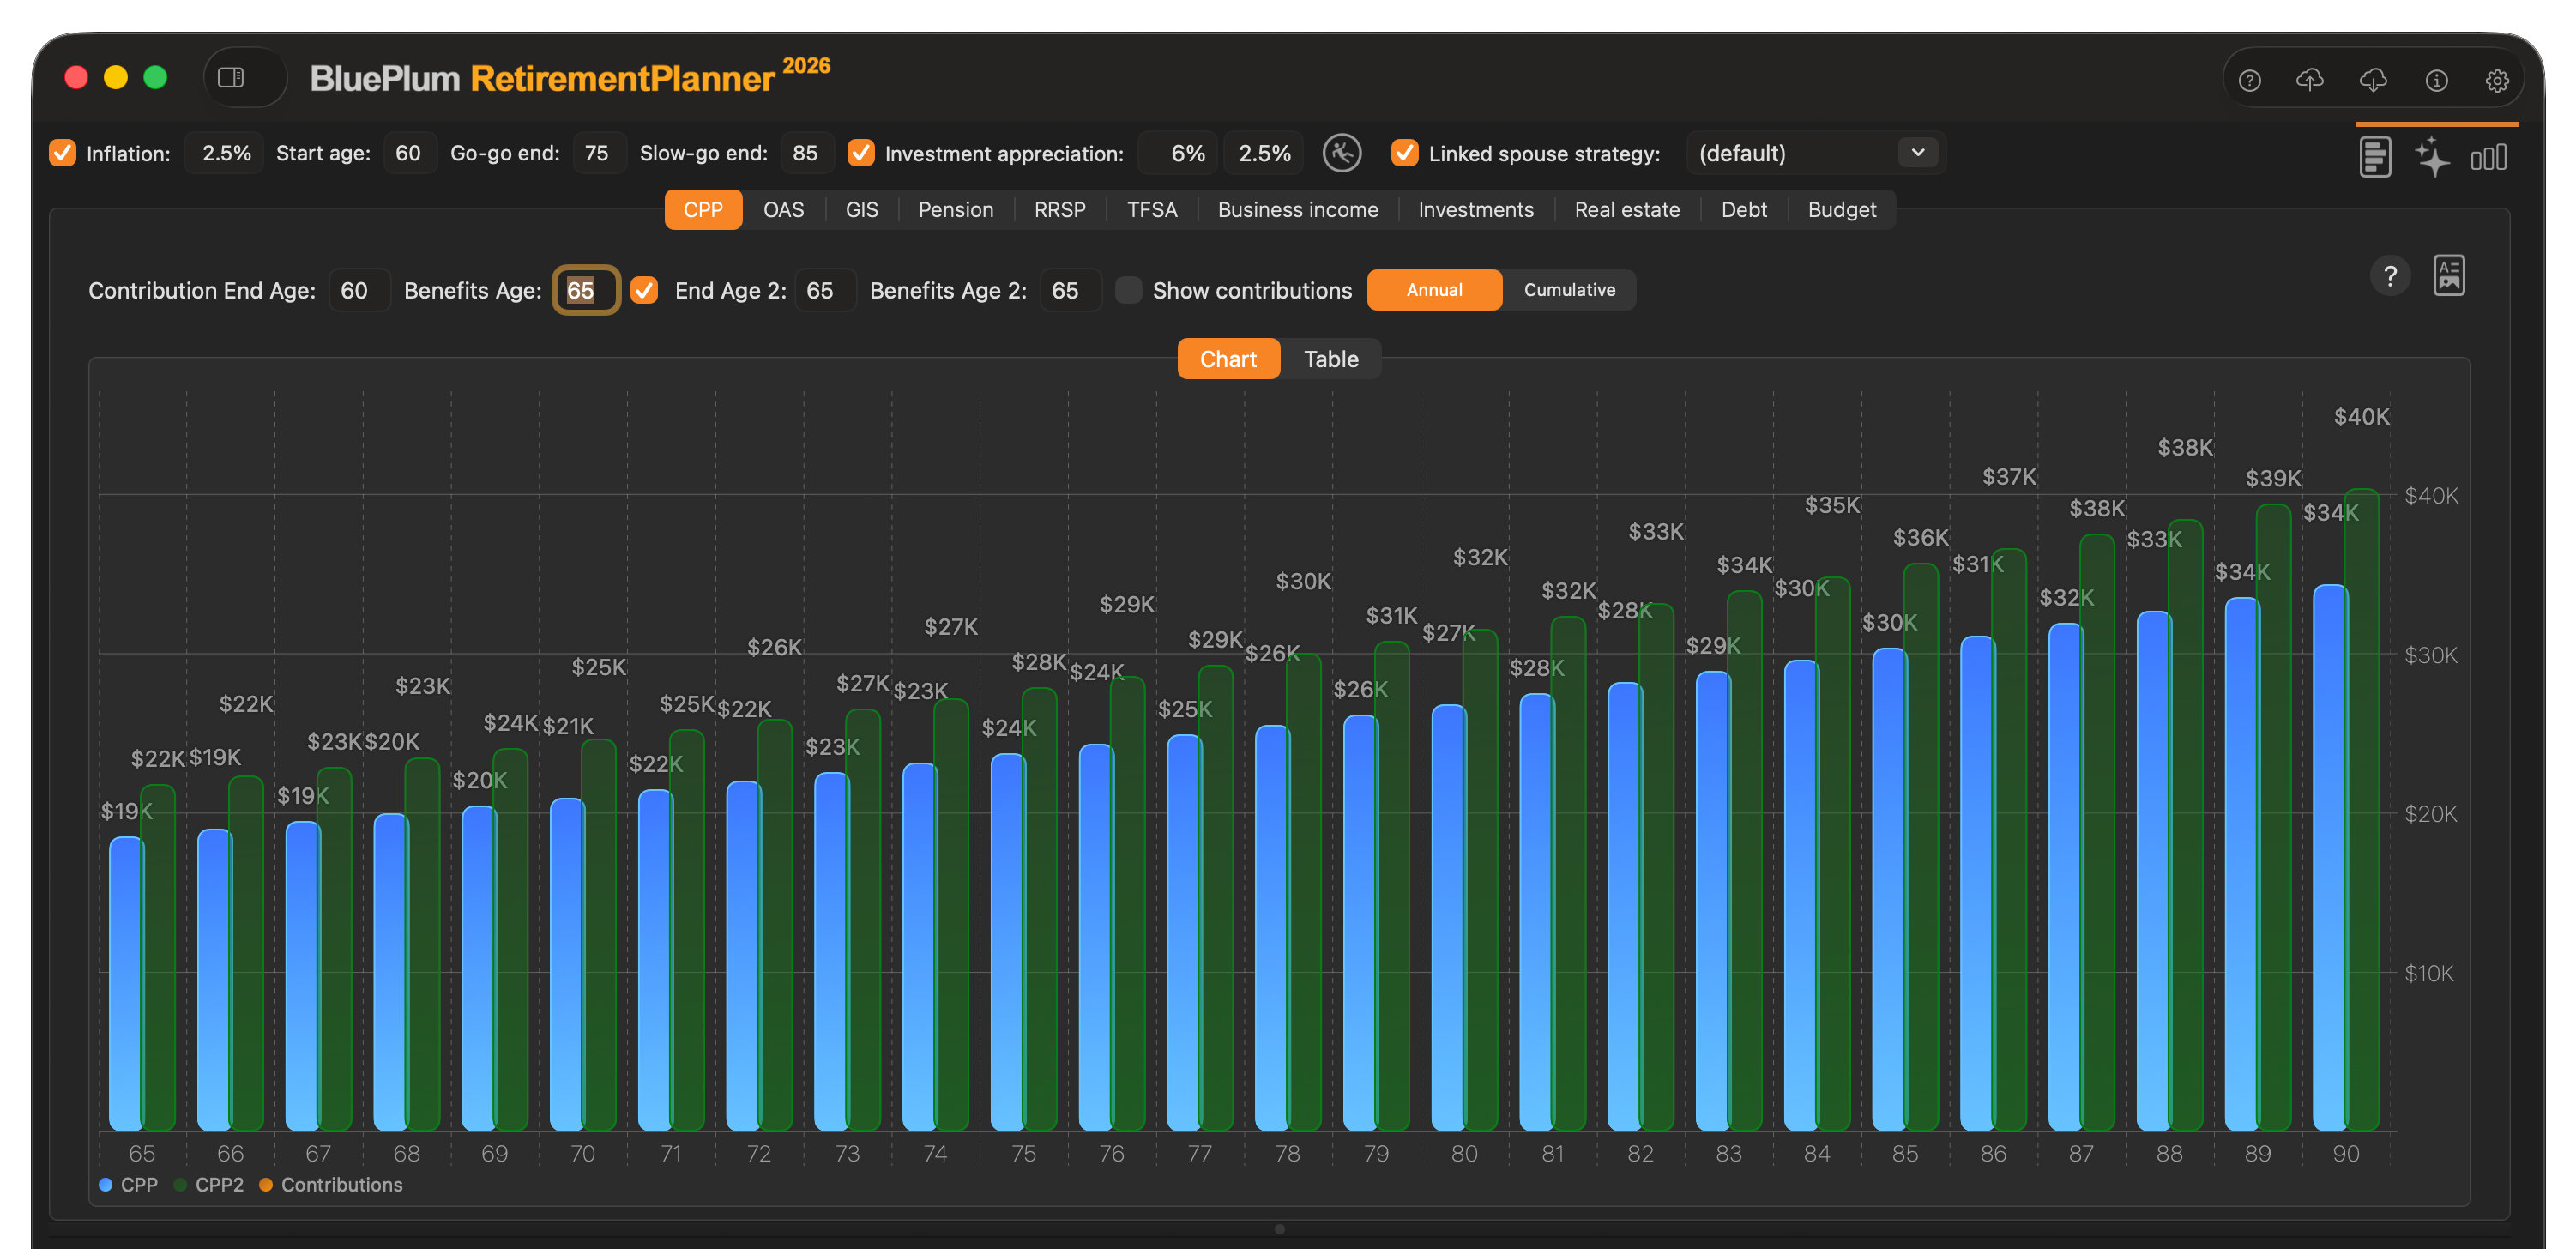
Controls
- Contribution End Age — the age at which CPP contributions stop (typically the retirement start age or the end of employment).
- Benefits Age — the age at which the client begins collecting CPP. Can be any age from 60 to 70.
- End Age 2 / Benefits Age 2 — enable the checkbox to model a second CPP contribution period or start-age scenario. Useful for clients who had career breaks or who want to compare starting at age 65 versus 70 for example.
- Show contributions — overlays a visual representation of historical contributions onto the chart.
- Annual / Cumulative — switches between yearly benefit amounts and a running total of all CPP payments received.
- Chart / Table — switches between the graphical chart view and a numeric table view.
Table view
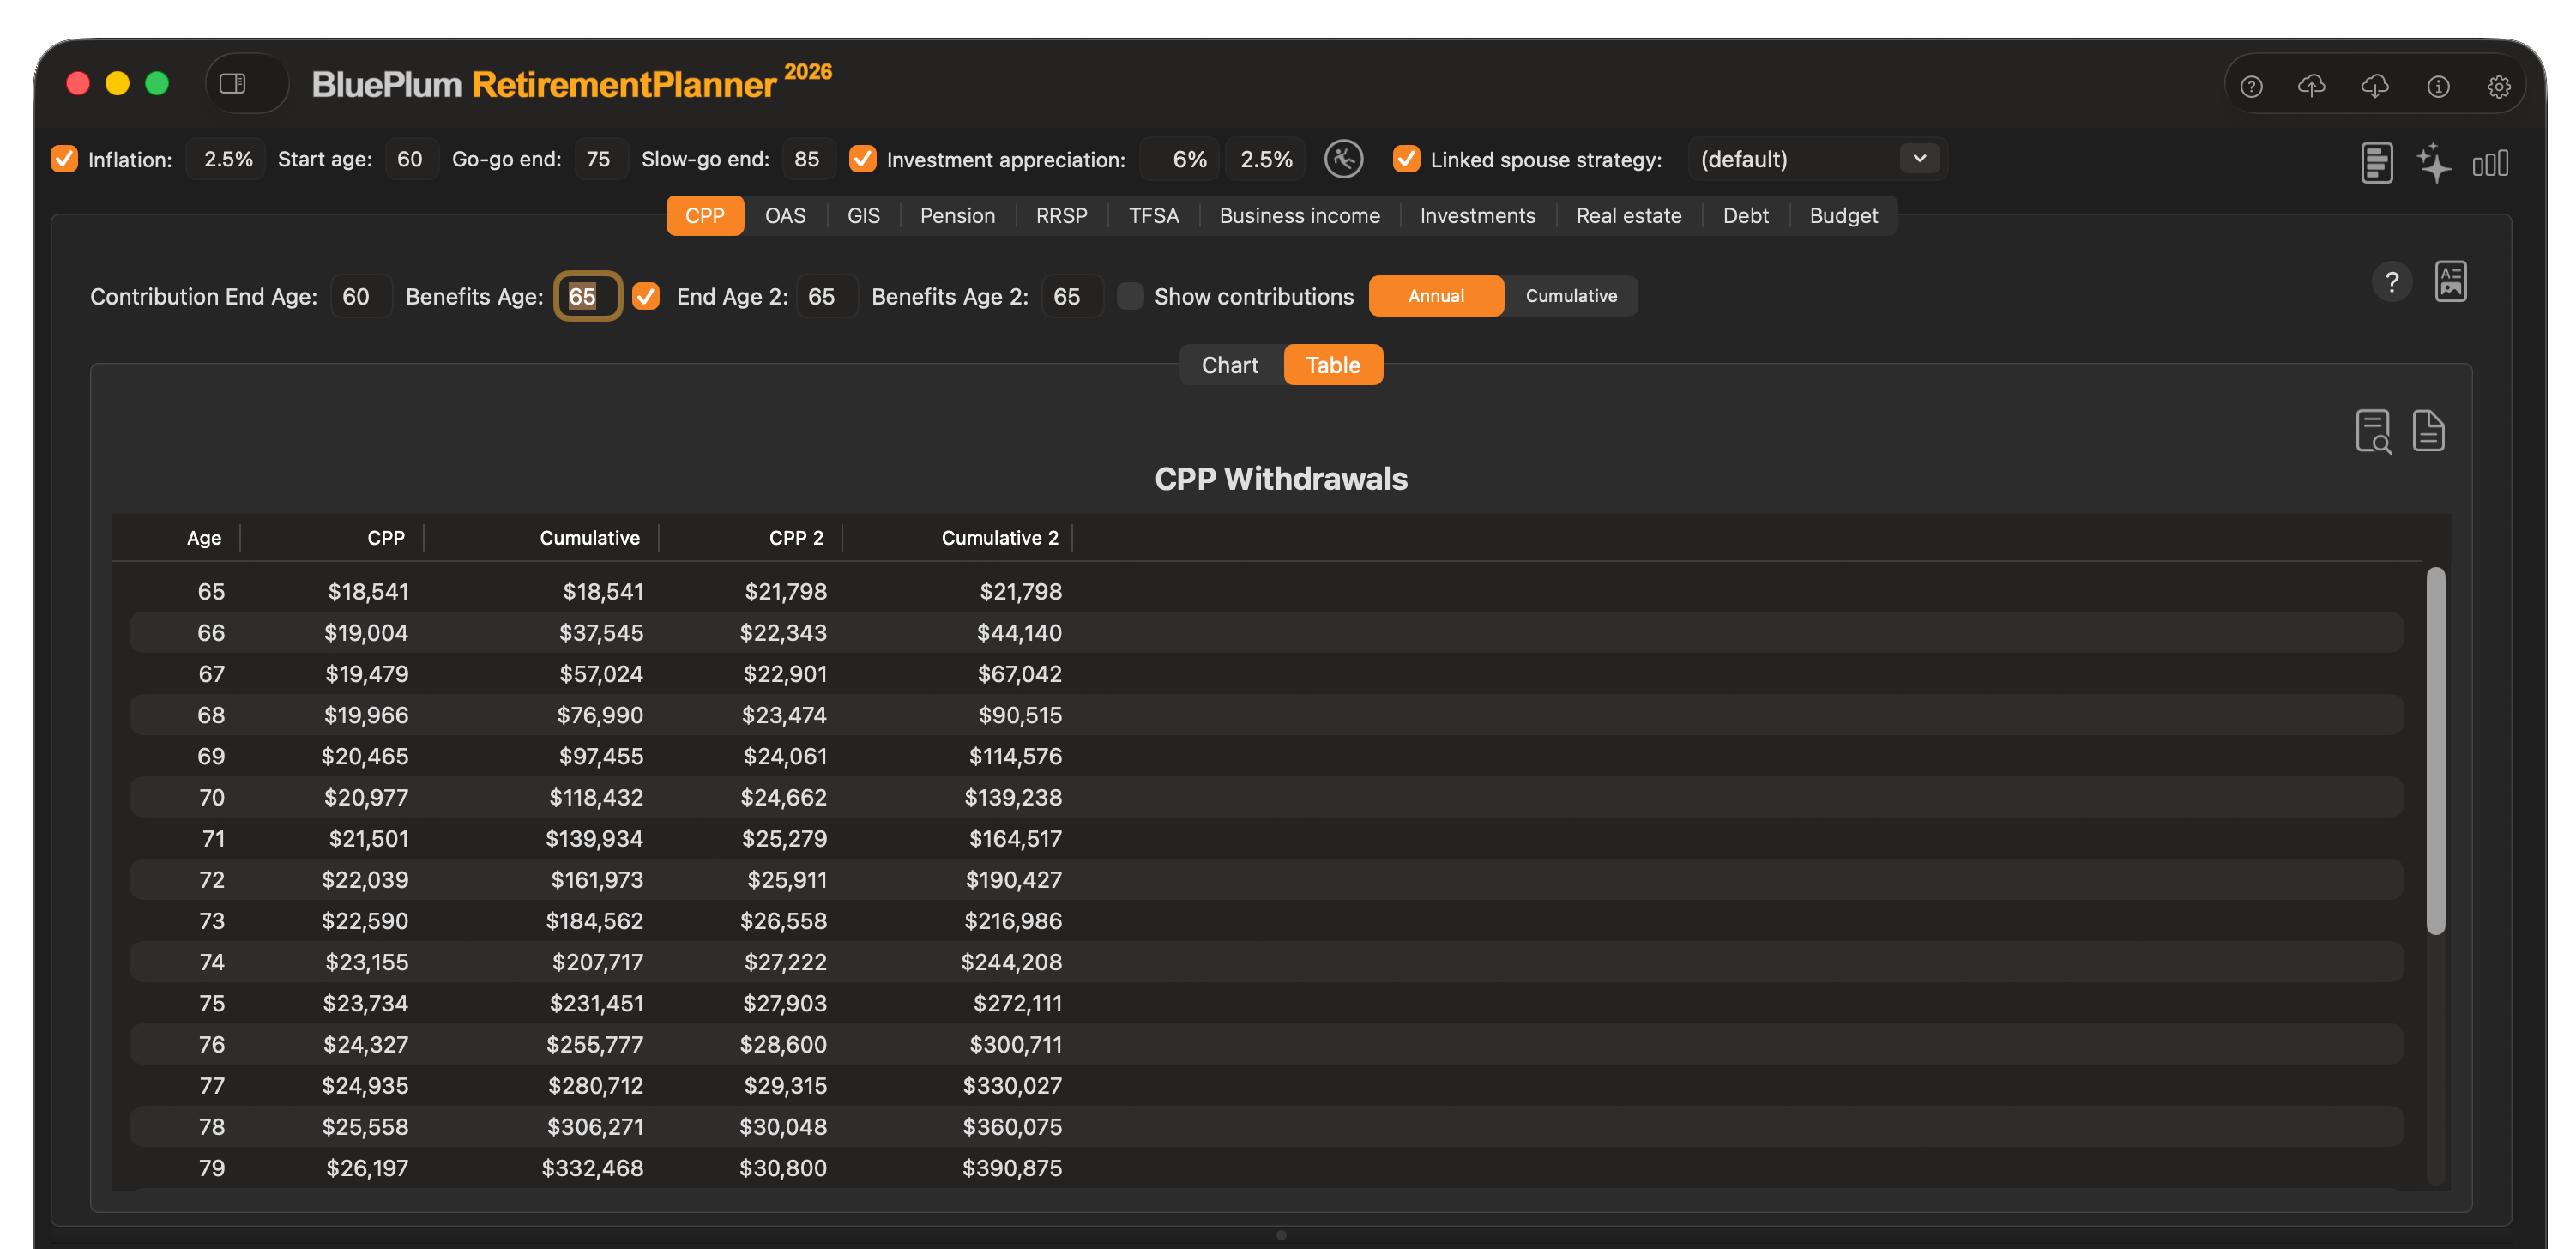
Switch to Table to see a year-by-year numeric breakdown. The table has the following columns:
| Column | Description |
|---|---|
| Age | The client’s age for each row |
| CPP | The projected annual CPP benefit under the primary scenario (using Benefits Age) |
| Cumulative | The running total of all CPP benefits received under the primary scenario up to that age |
| CPP 2 | The projected annual CPP benefit under the second scenario (using Benefits Age 2). Only populated when the End Age 2 / Benefits Age 2 checkbox is enabled |
| Cumulative 2 | The running total of all CPP benefits received under the second scenario up to that age |
This side-by-side layout makes it easy to compare two CPP start-age strategies — for example, starting at age 60 versus age 65 — and to see at which age the cumulative totals cross over.
Toolbar and context menu actions
Several export and copy actions are available across all strategy tabs, split between toolbar icons and right-click context menus.
Toolbar icons (top-right of the tab):
- Export to PDF — renders the table as a PDF and prompts you for a save location.
- Print preview — opens a preview of the printed table, from which you can print or save as PDF.
- ? (chart view only) — displays contextual help explaining the current tab’s content and how values are calculated.
Right-click anywhere on the table for four export actions:
- Copy as CSV — copies the table to the clipboard as comma-separated values. This is the quickest way to paste the data into Excel, Numbers, or Google Sheets.
- Copy as JSON — copies the table to the clipboard as JSON, suitable for a script or data analysis tool.
- Save as CSV… — writes the table to a
.csvfile at a location you choose. - Save as JSON… — writes the table to a
.jsonfile at a location you choose.
Right-click the chart for:
- Copy to clipboard — copies the chart image to the macOS clipboard so it can be pasted directly into a document, email, or presentation.
These actions are available on all strategy tabs, not just CPP. They work identically across all income source views.
How CPP benefits are calculated
The app estimates CPP retirement benefits based on the client’s contribution history (entered in the CPP tab of the Client edit form — see Section 6.1). The calculation follows the CRA benefit estimation rules:
- Contributions are matched against the Year’s Maximum Pensionable Earnings (YMPE) for each year.
- The general 17% drop-out provision is applied (low-earning years are excluded from the average).
- Starting before age 65 reduces the benefit by 0.6% per month (7.2% per year); deferring past 65 increases it by 0.7% per month (8.4% per year), up to age 70.
- CPP2 (the enhanced second component, in effect from 2024) is included in the benefit calculation. CPP2 contributions apply to earnings between the first and second earnings ceilings (YMPE and YAMPE) and increase the total projected CPP benefit.
CRA reference: Canada.ca — CPP retirement pension
7.5 OAS#
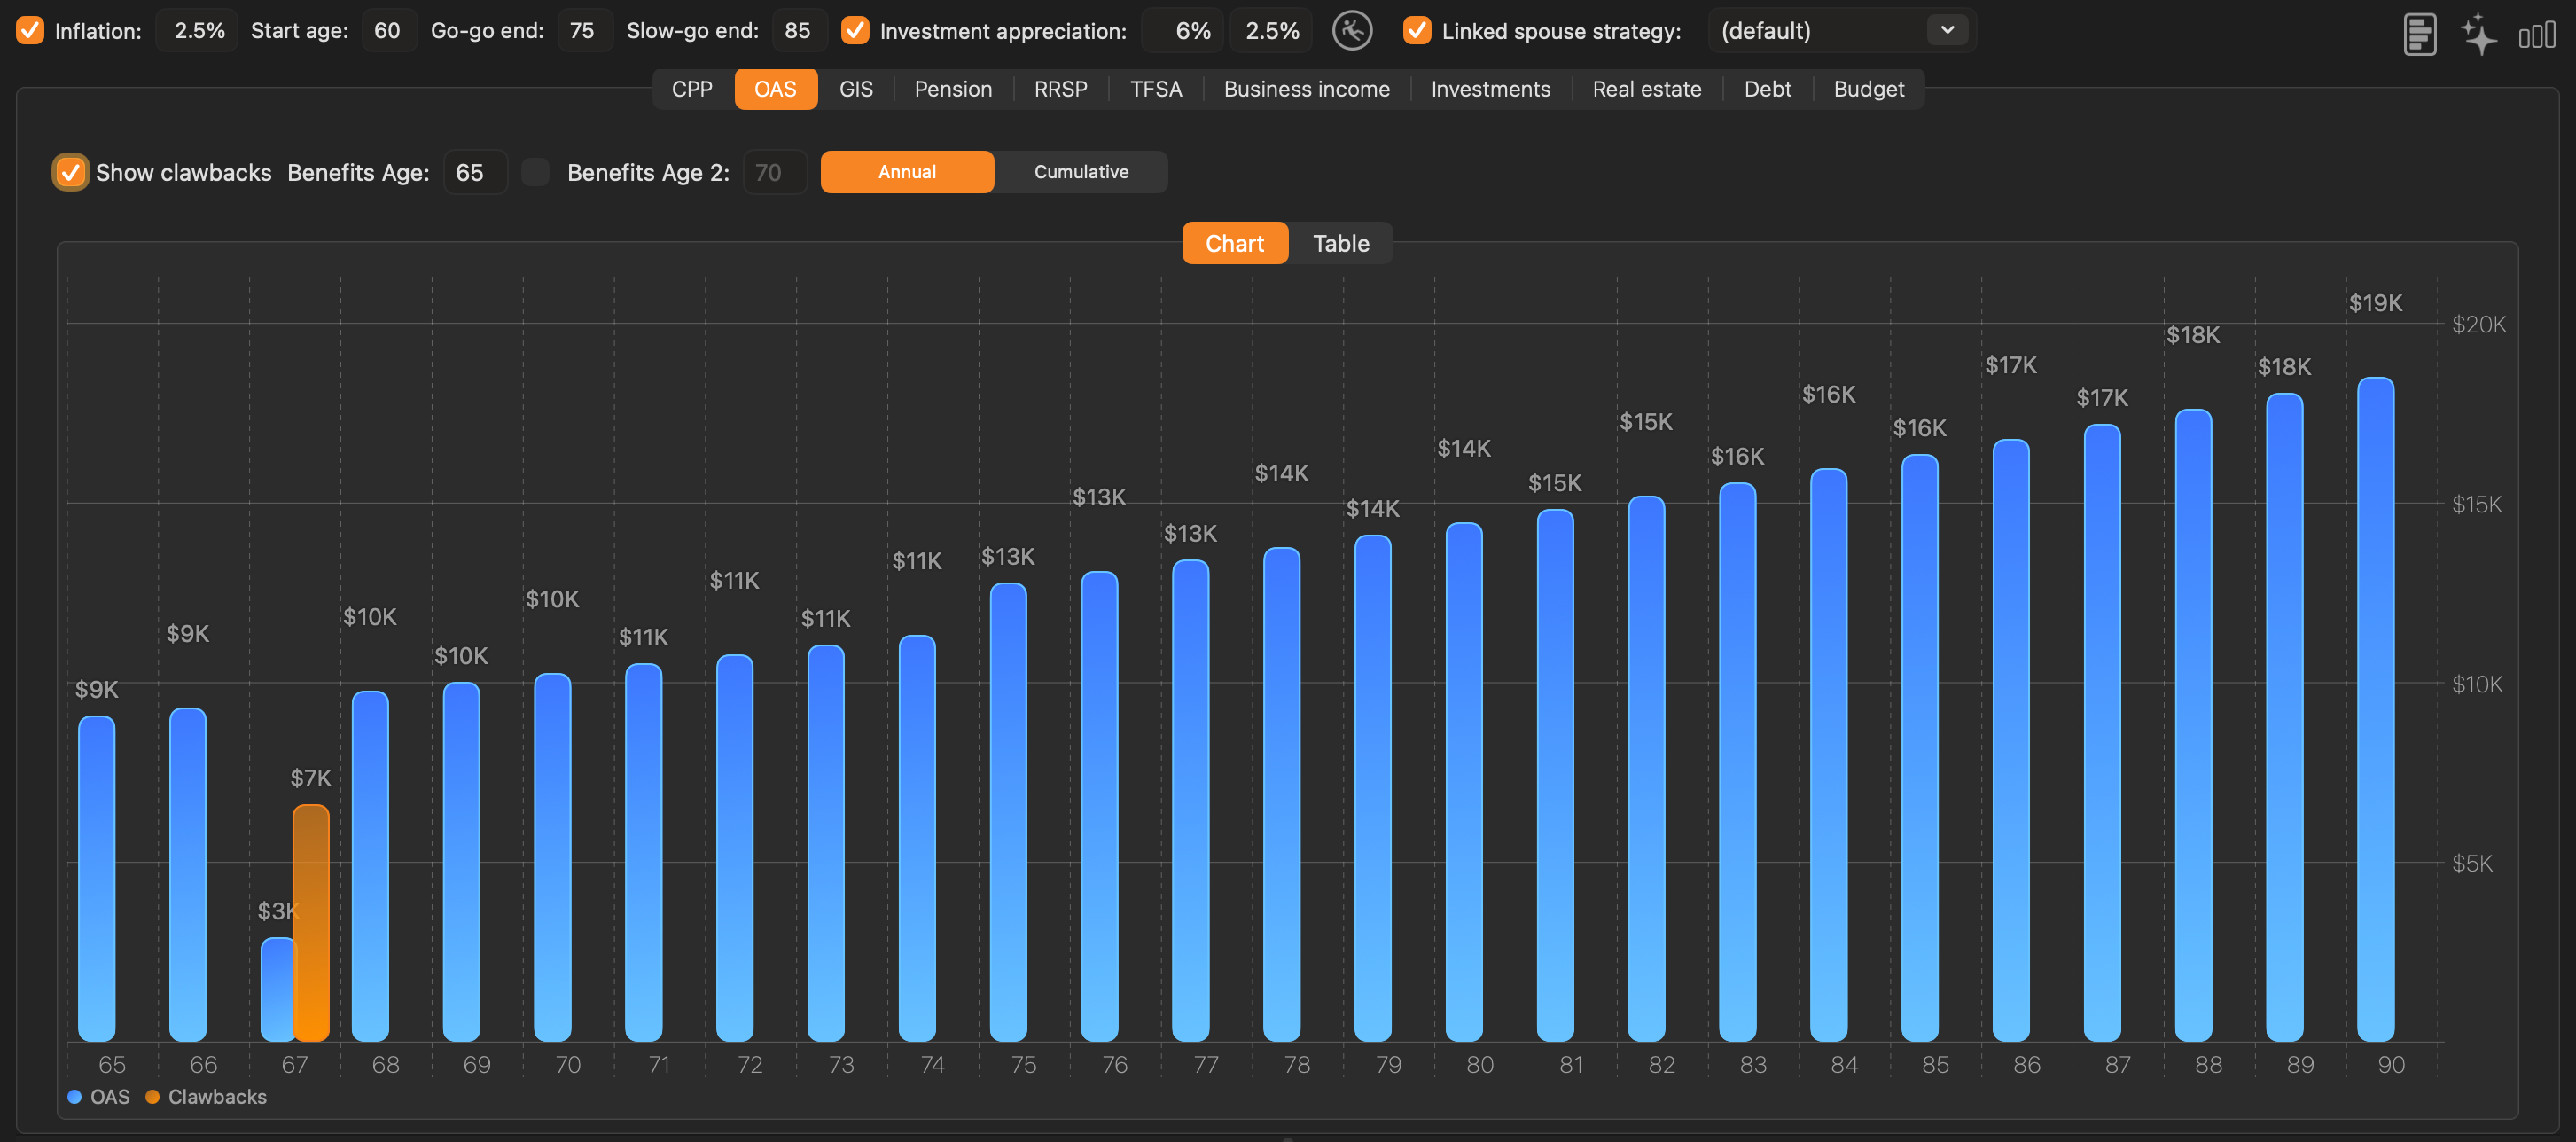
Controls
- Show clawbacks — when checked, the chart and table reflect the OAS Recovery Tax. If the client’s projected net income exceeds the annual clawback threshold, OAS is reduced accordingly.
- Benefits Age — the age at which OAS payments begin (65 by default).
- Benefits Age 2 — enable the checkbox to model a second OAS start-age scenario. For example, compare starting at 65 versus deferring to 70 for a 36% higher benefit.
- Annual / Cumulative — switches between yearly benefit amounts and a running total.
- Chart / Table — switches between the graphical chart view and a numeric table view.
Table view
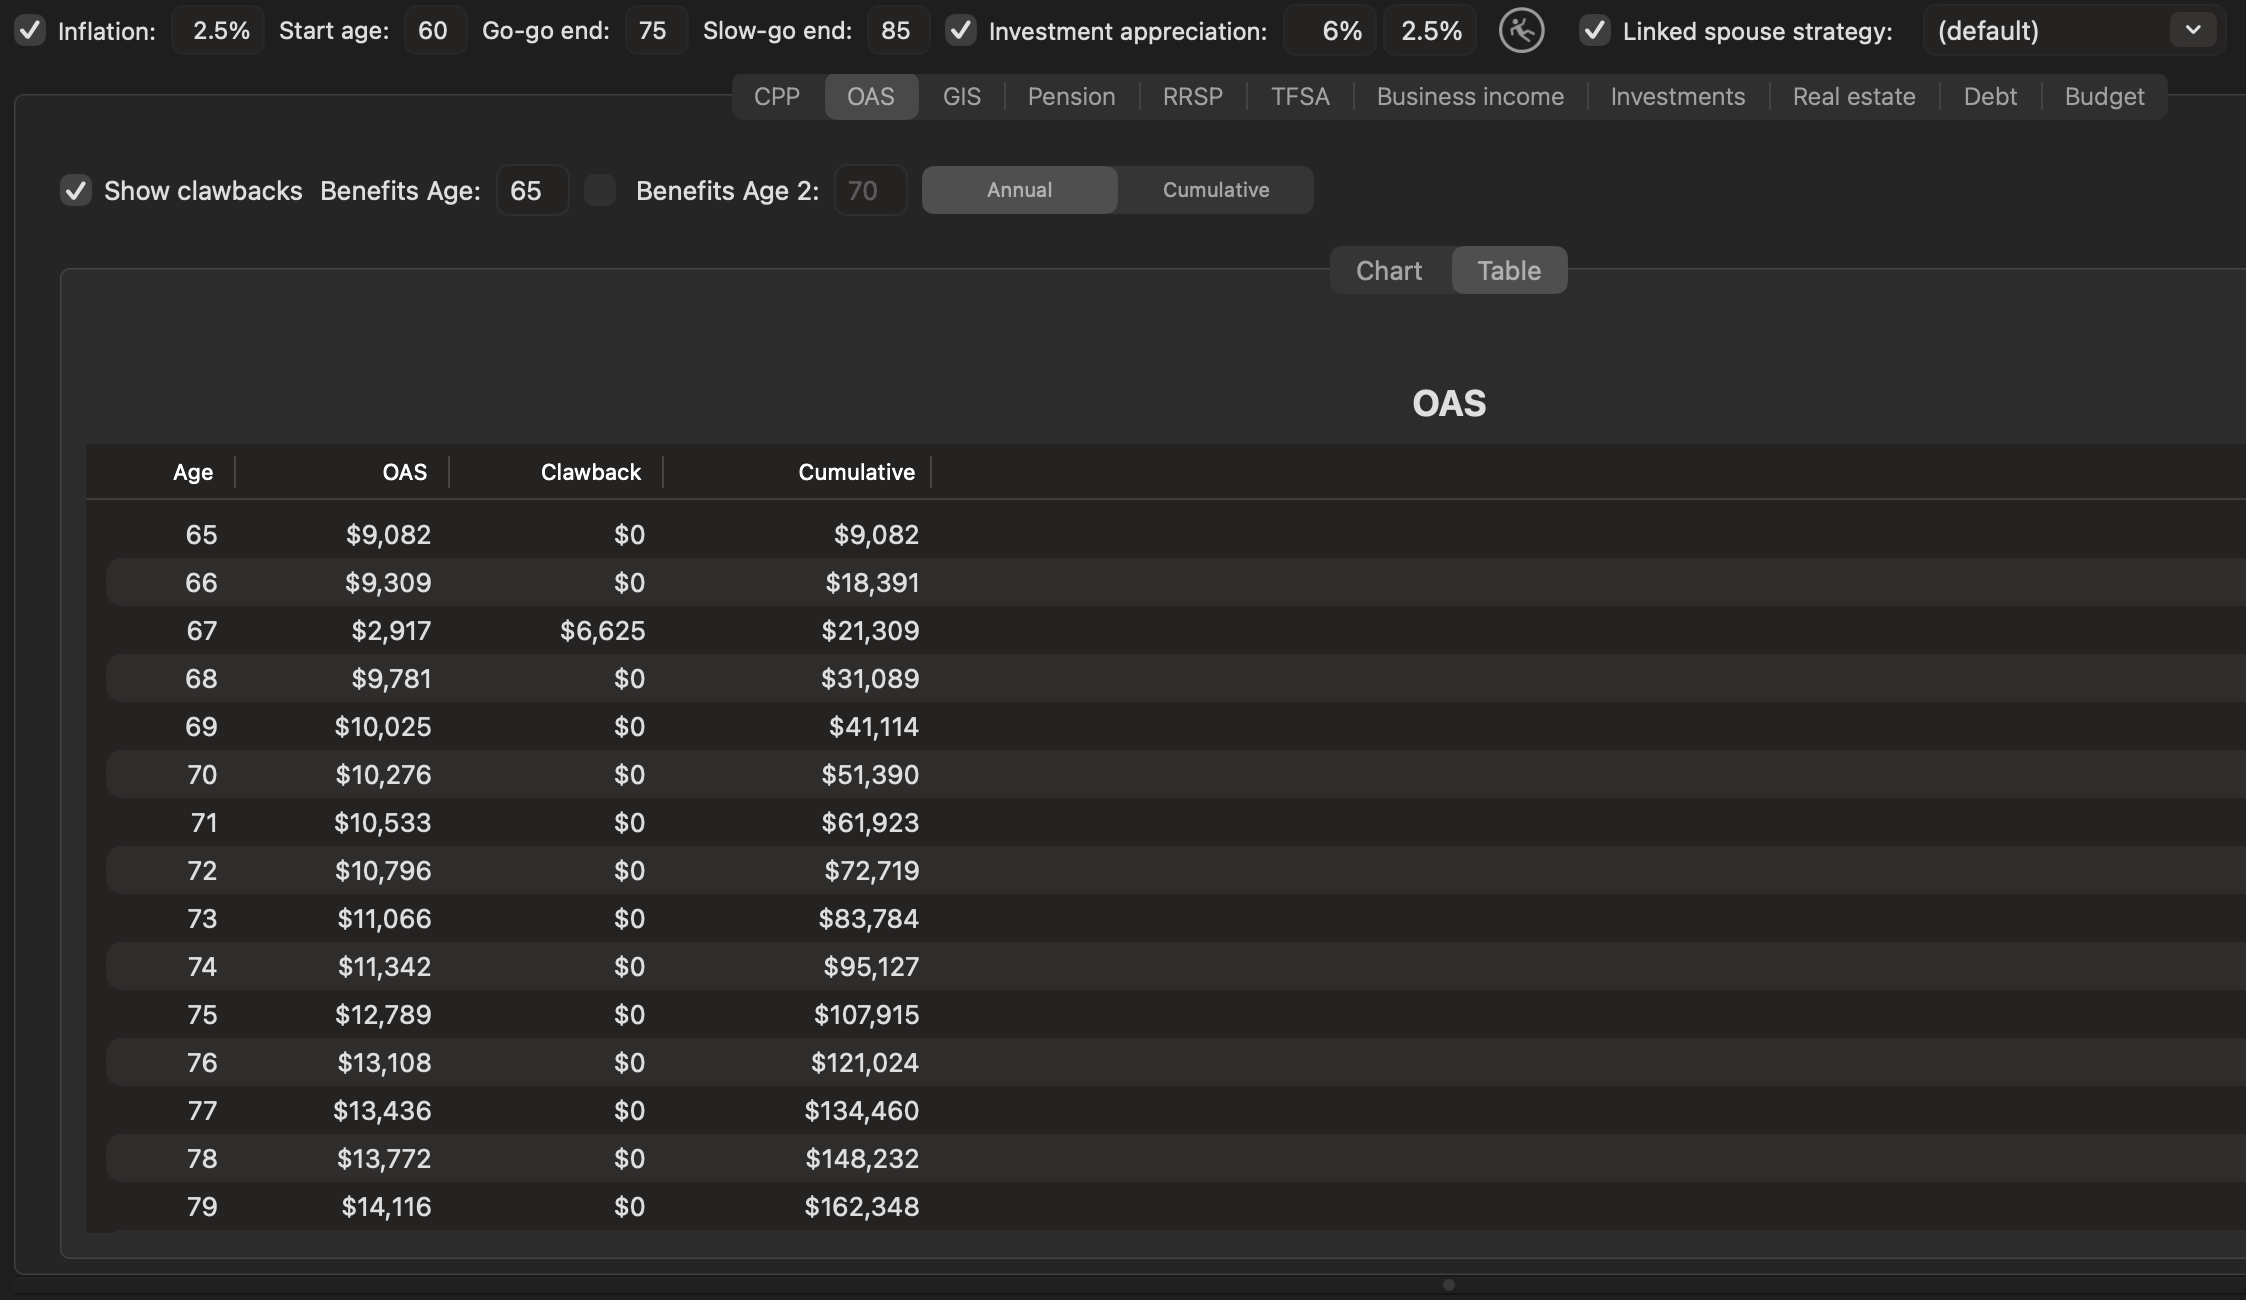
Switch to Table to see a year-by-year numeric breakdown. The table has the following columns:
| Column | Description |
|---|---|
| Age | The client’s age for each row |
| OAS | The projected annual OAS benefit for that year (after any clawback reduction if Show clawbacks is enabled) |
| Clawback | The OAS Recovery Tax amount deducted for that year. Shows $0 when net income is below the clawback threshold |
| Cumulative | The running total of all OAS benefits received up to that age |
The same export actions described in Section 7.4 are available here — right-click the table for Copy or Save as CSV/JSON, and right-click the chart for Copy to clipboard.
How OAS is calculated
OAS eligibility is based on years of Canadian residency (entered in the OAS tab of the Client edit form — see Section 6.2). The benefit is calculated as:
- Full pension requires 40 years of Canadian residency after age 18. Partial pensions are prorated at 1/40th per year.
- Deferring past age 65 increases the monthly benefit by 0.6% per month (7.2% per year), to a maximum of 36% more at age 70.
- The OAS Recovery Tax (clawback) applies at 15% of net income above the annual threshold (approximately $90,997 for 2025). When net income exceeds approximately $148,451, the entire OAS pension is clawed back.
- OAS payments are indexed quarterly to the Consumer Price Index (CPI), which the app models using the inflation rate set in the strategy.
CRA reference: Canada.ca — Old Age Security pension
7.6 GIS#
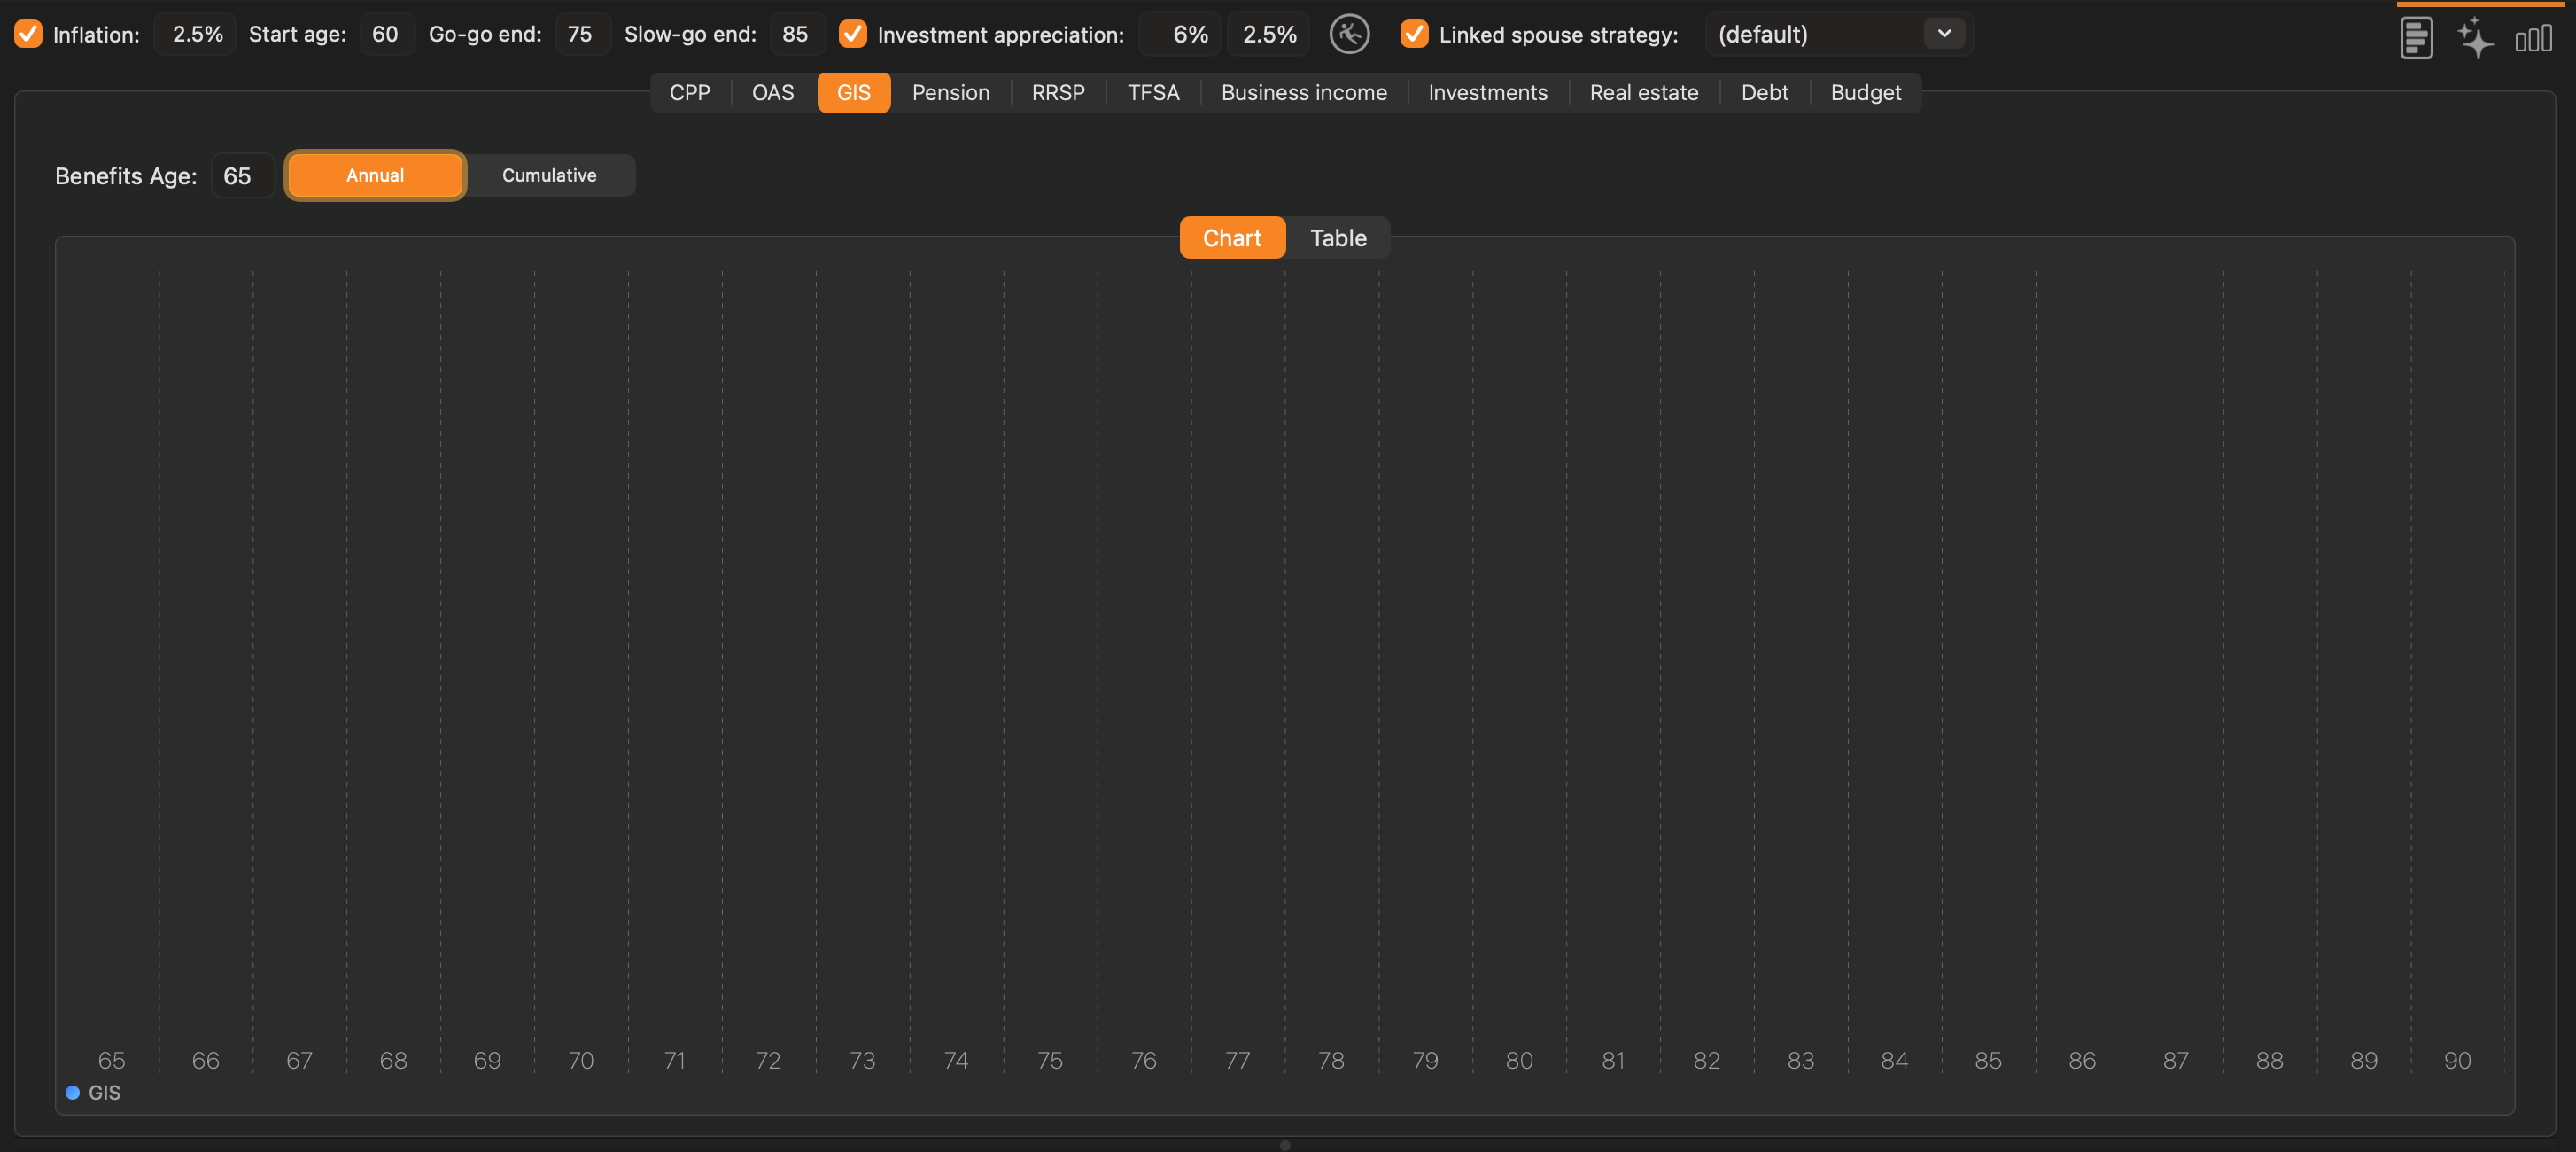
Controls
- Benefits Age — the age from which GIS is calculated (must be 65 or later). Setting this to a very high value (e.g. 100) effectively disables GIS from the projection.
- Annual / Cumulative — switches between yearly benefit amounts and a running total.
- Chart / Table — switches between the graphical chart view and a numeric table view.
Table view
The GIS table contains the following columns:
| Column | Description |
|---|---|
| Age | The client’s age for each row |
| GIS | The projected annual GIS benefit for that year, automatically calculated based on net income |
| Cumulative | The running total of all GIS benefits received up to that age |
The same export actions described in Section 7.4 are available here — right-click the table for Copy or Save as CSV/JSON, and right-click the chart for Copy to clipboard.
How GIS is calculated
GIS is a non-taxable monthly benefit for low-income OAS recipients. The app calculates GIS entitlement automatically each year based on the client’s projected net income and the marital-status and spouse-income settings entered in the GIS tab of the Client edit form (see Section 6.3).
- For single recipients, GIS is reduced by 50 cents for every dollar of income (excluding OAS) above the applicable exempt amount.
- For married/common-law couples, GIS is reduced based on the combined income of both partners (excluding OAS), using the applicable couples rate table.
- Whether the spouse is also receiving OAS affects which rate table is used.
- GIS payments are indexed quarterly to the CPI.
Note: If the GIS chart is empty (as shown above), the client’s projected income is too high to qualify for GIS in any year.
CRA reference: Canada.ca — Guaranteed Income Supplement
7.7 Pension#
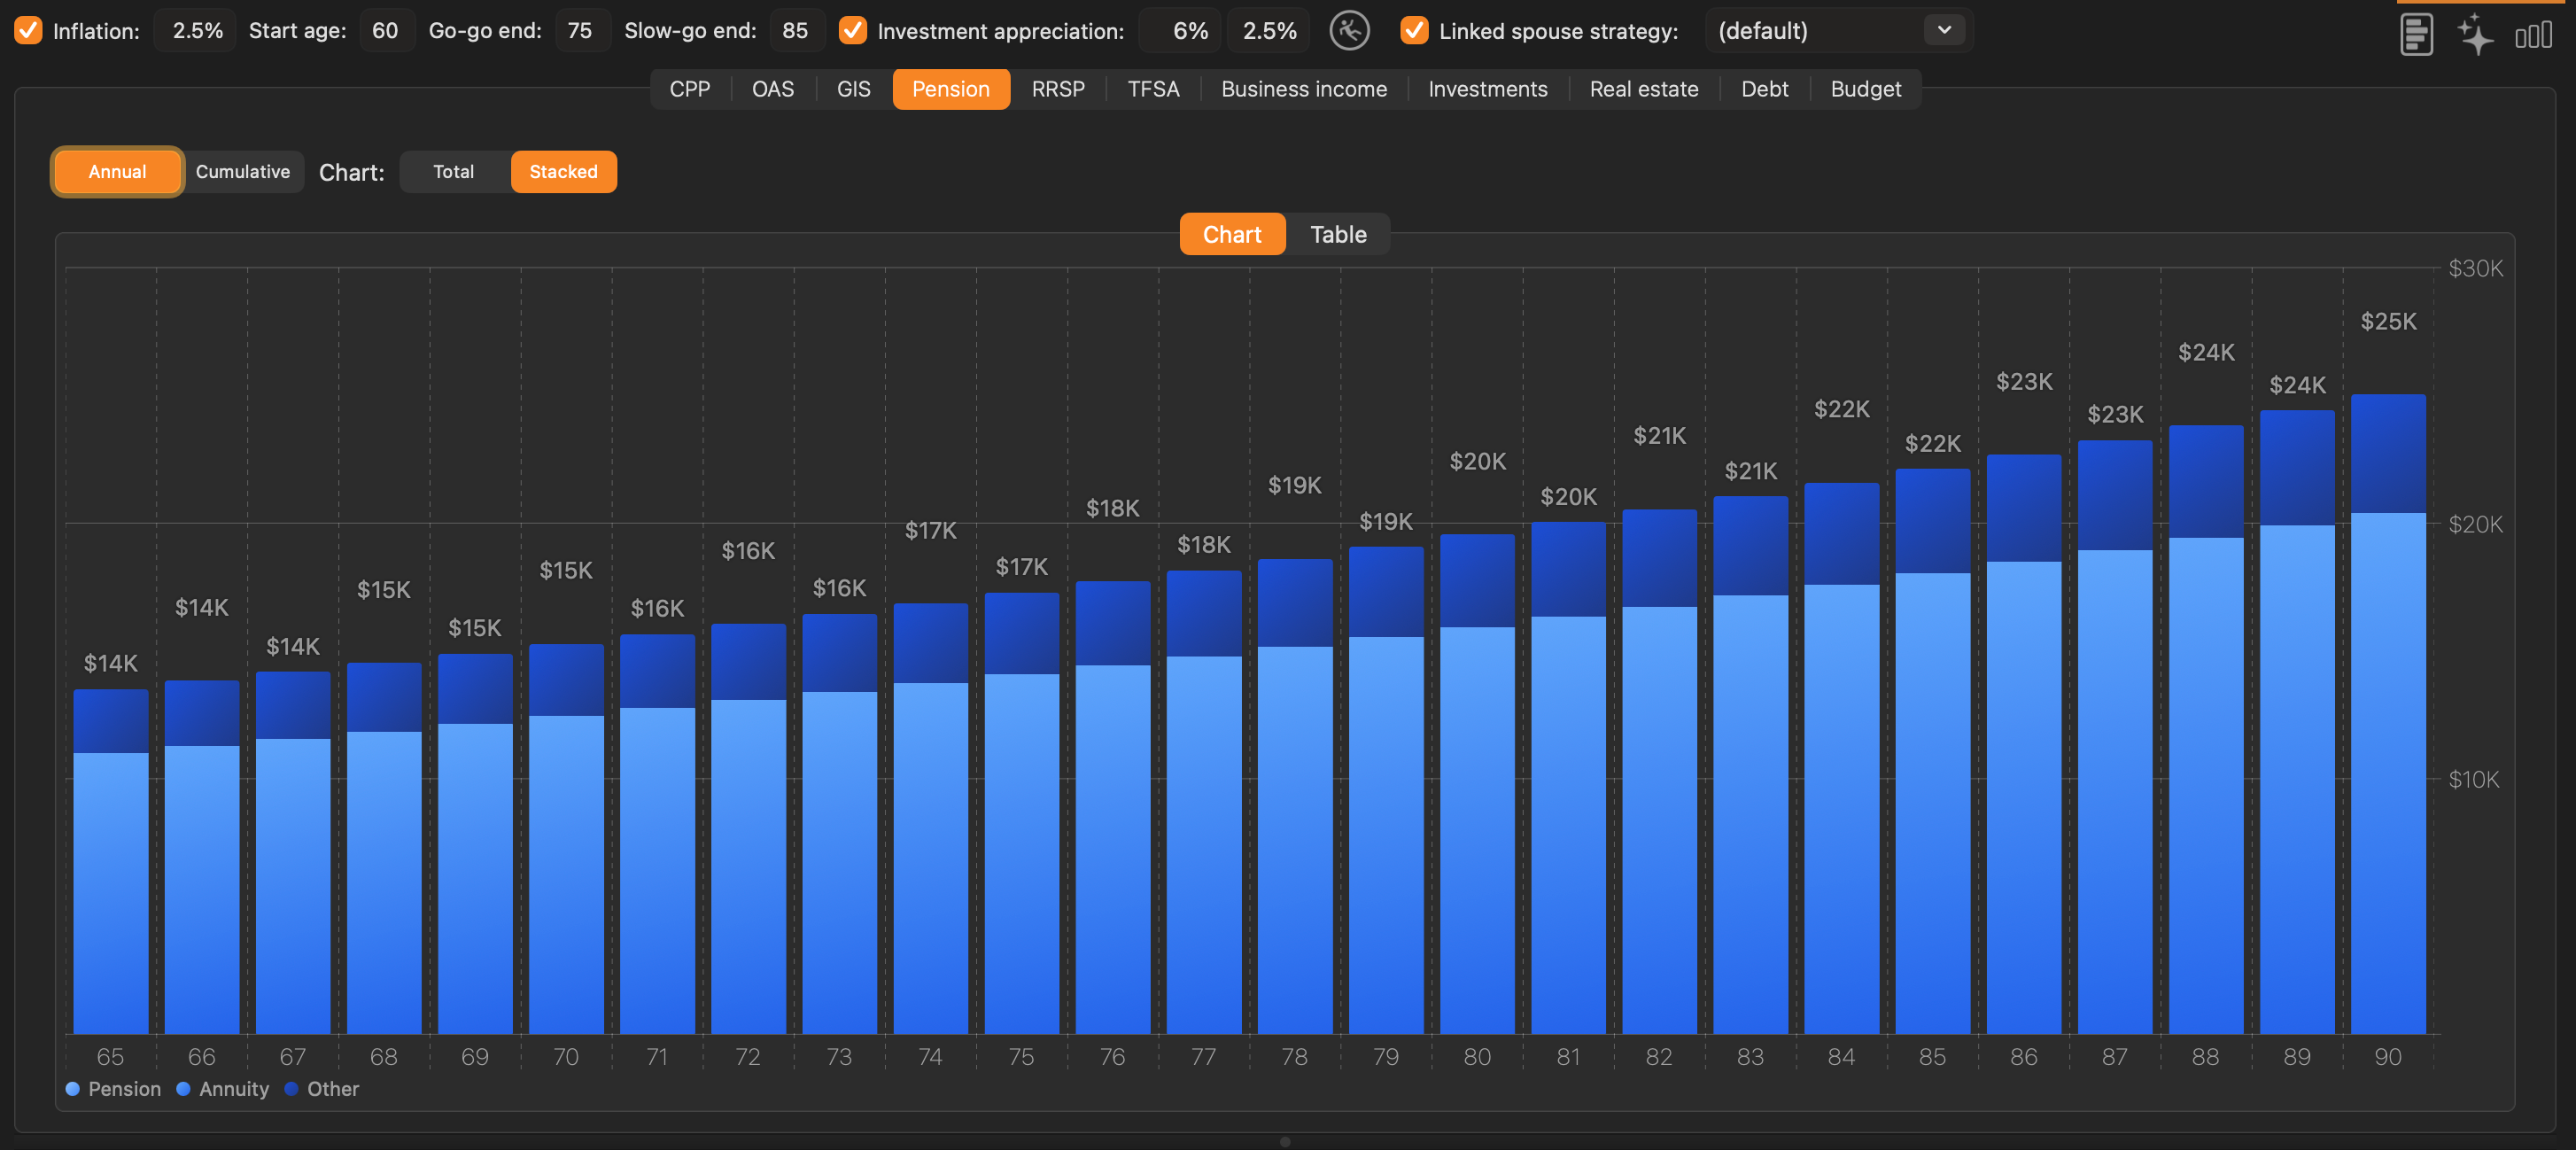
Controls
- Annual / Cumulative — switches between yearly benefit amounts and a running total of all pension, annuity, and other income received.
- Total / Stacked — Total shows the combined pension + annuity + other income as a single bar; Stacked shows each income stream as a separate coloured band so you can see the contribution of each.
- Chart / Table — switches between the graphical chart view and a numeric table view.
Table view
The Pension table contains the following columns:
| Column | Description |
|---|---|
| Age | The client’s age for each row |
| Pension | The projected annual defined-benefit pension amount for that year |
| Annuity | The projected annual annuity income for that year |
| Other | The projected annual other income for that year |
| Total | The combined total of pension + annuity + other for that year |
| Cumulative | The running total of all combined income received up to that age |
The same export actions described in Section 7.4 are available here — right-click the table for Copy or Save as CSV/JSON, and right-click the chart for Copy to clipboard.
How pension income is projected
This tab visualizes the values entered in the Pension/Annuity tab of the Client edit form (see Section 6.4). Each of the three income streams — pension, annuity, and other — starts at its configured start age and runs through to the expected age.
- When Indexed by inflation is checked for a stream, the amount grows each year at the inflation rate set in the strategy.
- When unchecked, the nominal amount remains fixed.
- Tax treatment depends on the Taxable checkbox set for each stream in the Client edit form.
CRA reference: Canada.ca — Pension income splitting
7.8 RRSP#
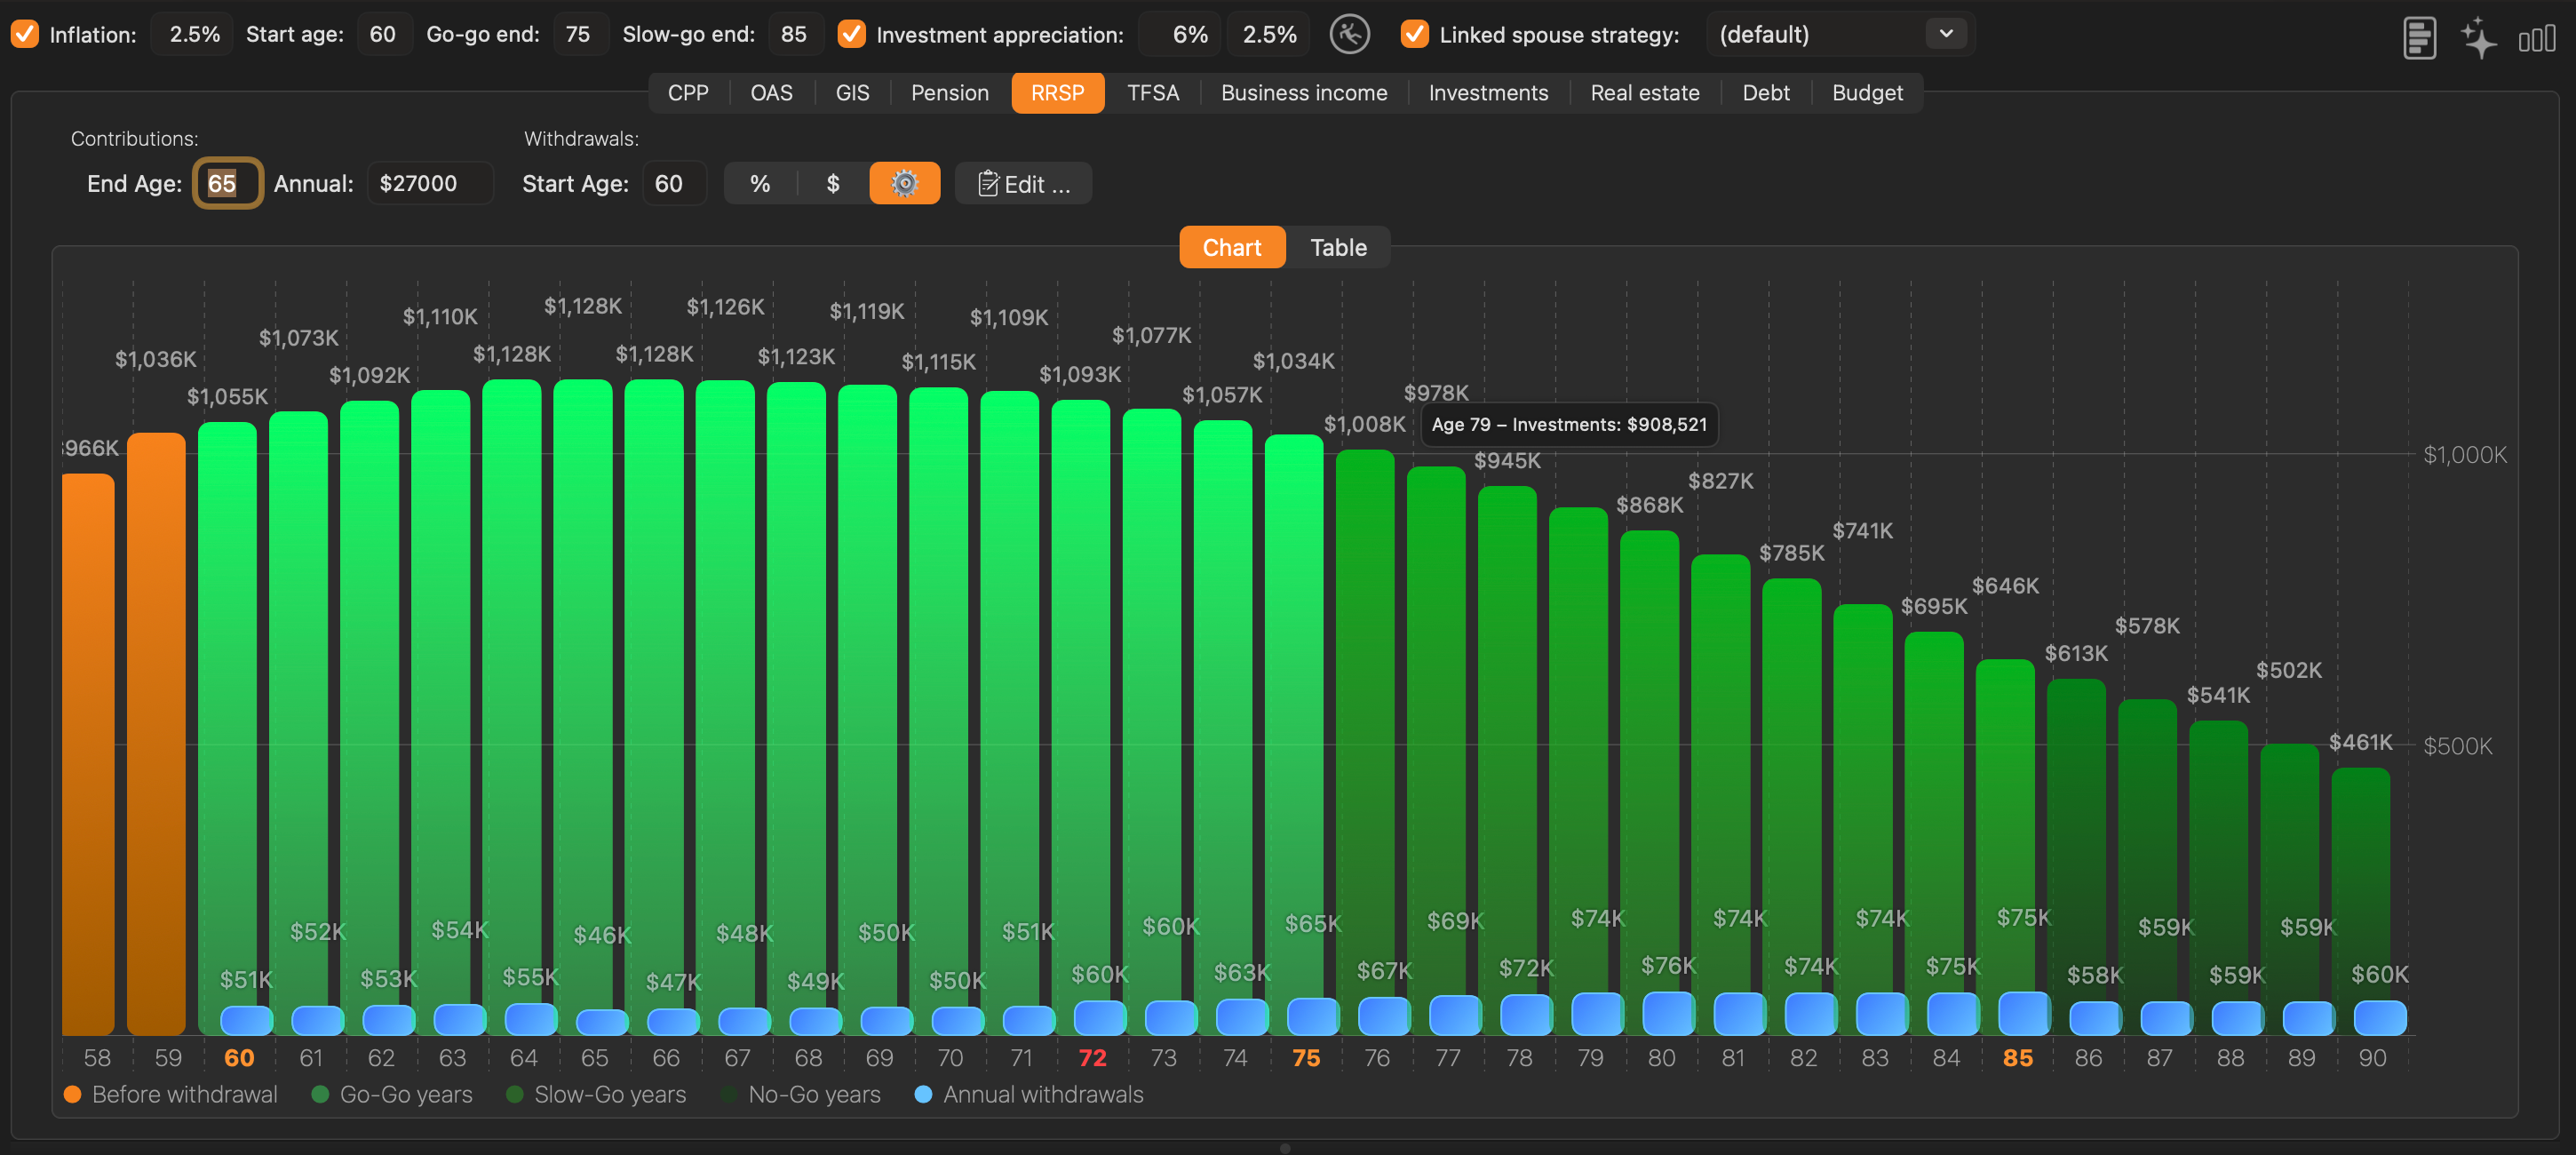
Controls
- Contributions: End Age — the last age at which annual RRSP contributions are made.
- Contributions: Annual — the dollar amount contributed to the RRSP each year up to the end age.
- Withdrawals: Start Age — the age at which voluntary withdrawals begin.
- Chart / Table — switches between the graphical chart view and a numeric table view.
Withdrawal mode toggle (% / $ / Custom)
The withdrawal mode determines how the app calculates the annual withdrawal amount during each of the three retirement phases (Go-Go, Slow-Go, No-Go):
% (Percentage mode) — the withdrawal each year is a fixed percentage of the account’s current balance at the start of that year. Because the balance changes year to year, the dollar amount withdrawn also changes. For example, a 5% withdrawal from a $1,000,000 balance yields $50,000 that year; if the balance drops to $900,000 the next year, the withdrawal is $45,000. This approach naturally adjusts spending to portfolio performance.
$ (Dollar mode) — the withdrawal each year is a fixed dollar amount, regardless of the account balance. For example, $50,000 per year is withdrawn every year in the applicable phase. This provides predictable income but may deplete the account faster if returns are lower than expected.
Gear icon — activates custom withdrawals mode. When enabled (highlighted in orange), the app uses the per-age withdrawal schedule configured in the Edit dialog (see below). When disabled, the app uses the % or $ withdrawal amount uniformly or across the three Go-Go / Slow-Go / No-Go phases.
Custom withdrawals — the Edit dialog
Click the Edit… button to open the Retirement Plan Adjustments dialog, which provides full control over withdrawals at every individual age.
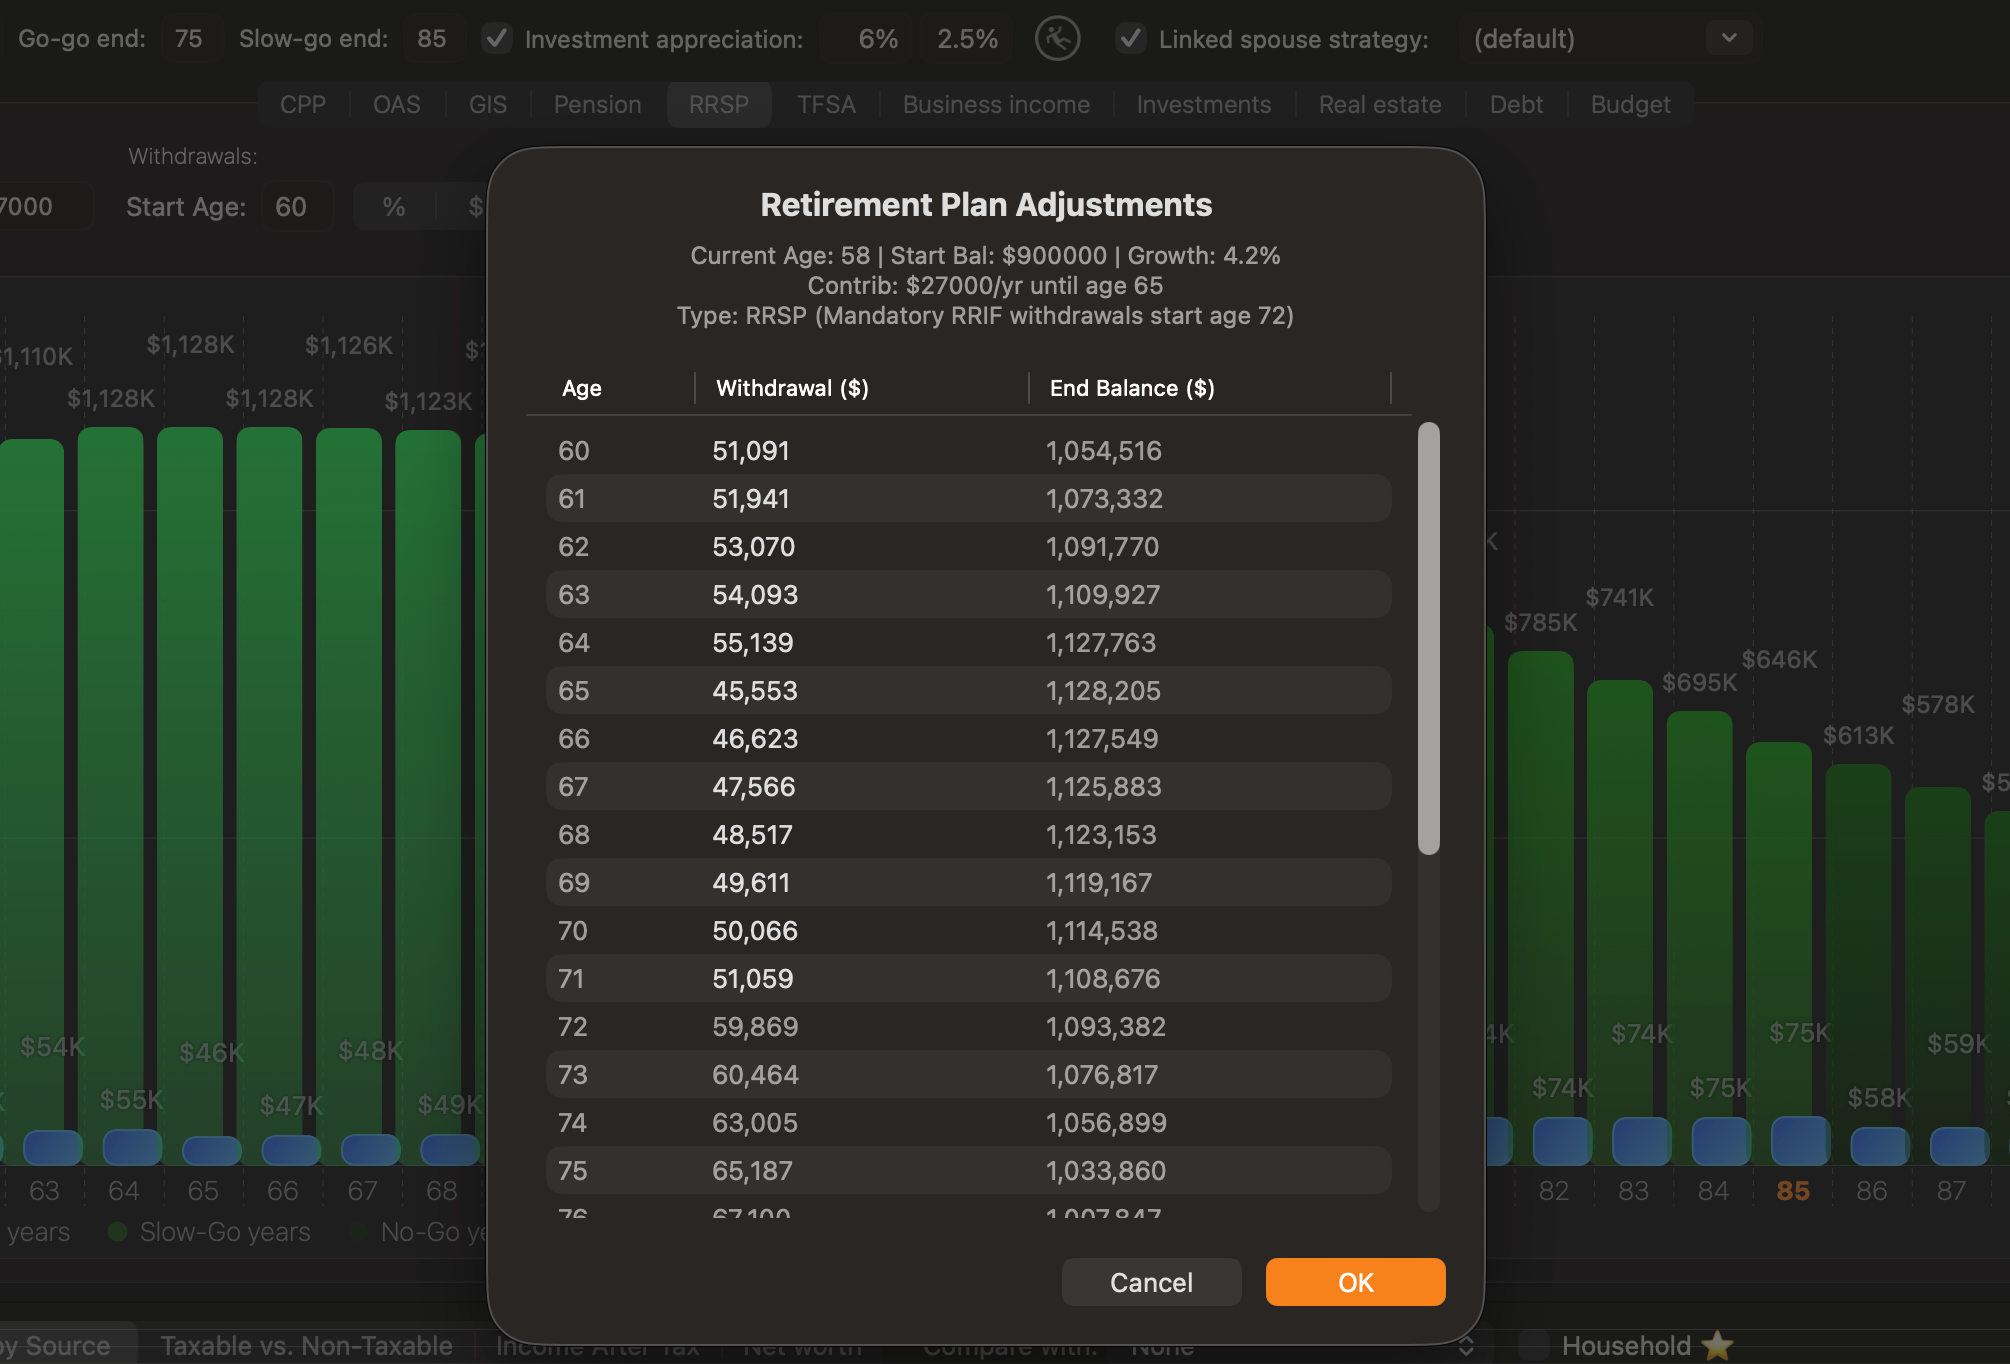
The dialog header displays a summary of the account:
- Current Age, Start Bal (starting balance), Growth (blended annual return rate)
- Contrib (annual contribution and end age)
- Type (RRSP, with a note giving the age at which mandatory RRIF withdrawals start — one year after the strategy’s RRIF conversion age, so 72 by default)
The table lists every age from the withdrawal start age to the expected age, with the following columns:
| Column | Description |
|---|---|
| Age | The client’s age |
| Withdrawal ($) | The dollar amount withdrawn at that age — click any cell to edit it directly |
| End Balance ($) | The projected account balance at the end of that year, after the withdrawal and investment growth have been applied |
You can click on any Withdrawal cell and type a new value. The End Balance column recalculates immediately to show the impact of your change.
Context menu options
Right-click on any row in the custom withdrawal table to access the following commands:
Update by inflation — adjusts the selected row’s withdrawal amount upward by the inflation rate set in the strategy. This is a one-time adjustment to the single selected row.
Update all subsequent by inflation (maximum over RRIF) — from the selected row onward, recalculates all withdrawal amounts by increasing them at the inflation rate each year. If a withdrawal would fall below the mandatory RRIF minimum for that age, the RRIF minimum is used instead (ensuring the higher of the inflation-adjusted amount or the RRIF minimum).
Update all subsequent by inflation (minimum according to RRIF) — from the selected row onward, sets all withdrawal amounts to the mandatory RRIF minimum for each age (based on the CRA prescribed percentages). This produces the smallest legally required withdrawals, preserving the account balance as long as possible.
Click OK to save your custom schedule, or Cancel to discard changes.
Tip: Custom withdrawals override the % and $ modes entirely. To return to automatic calculation, switch back to % or $ mode using the toggle — this discards the custom schedule.
Table view
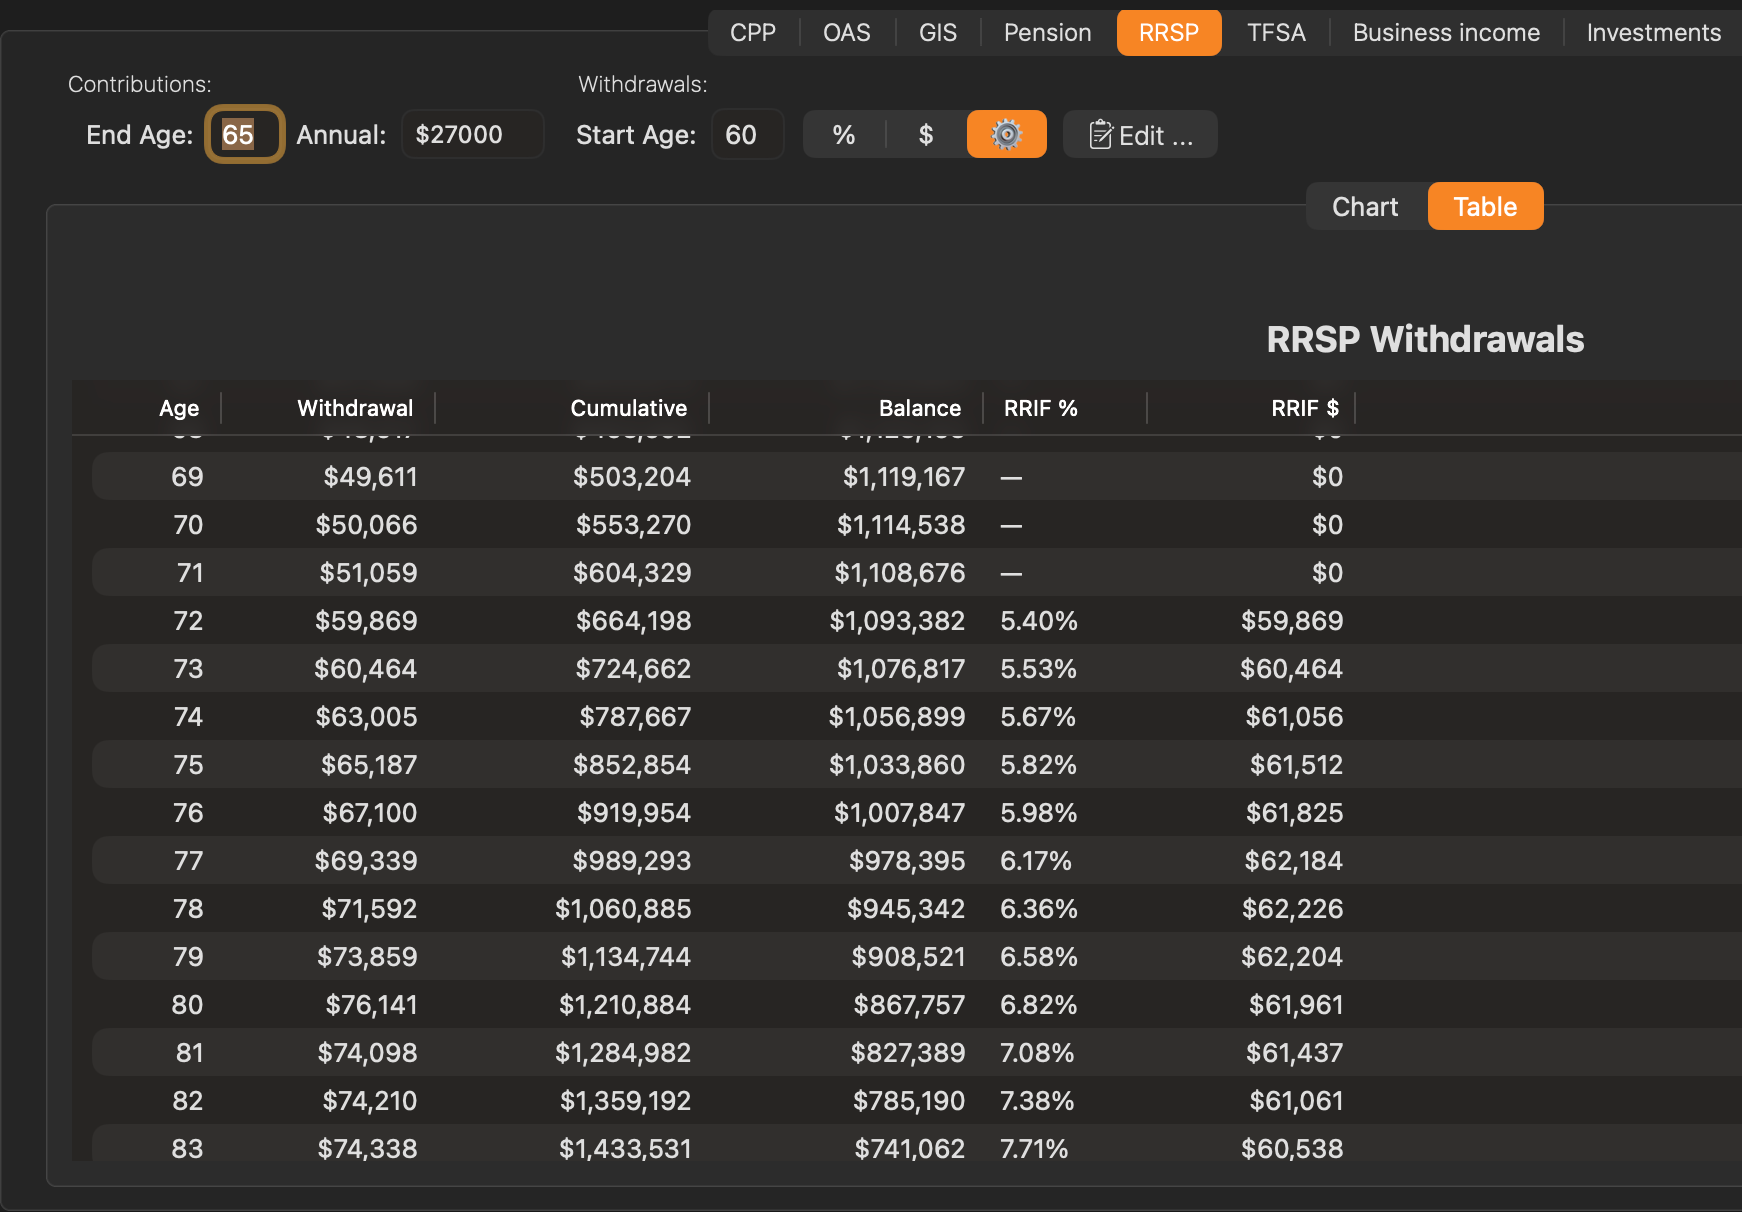
Switch to Table to see a year-by-year numeric breakdown. The table has the following columns:
| Column | Description |
|---|---|
| Age | The client’s age for each row |
| Withdrawal | The dollar amount withdrawn from the RRSP/RRIF at that age |
| Cumulative | The running total of all withdrawals taken up to that age |
| Balance | The projected account balance at the end of that year |
| RRIF % | The CRA prescribed minimum RRIF withdrawal percentage for that age. Shows a dash (—) for ages before RRIF rules apply |
| RRIF $ | The mandatory minimum RRIF withdrawal amount in dollars for that age, calculated as RRIF % × the account balance at the start of the year. Shows $0 before RRIF rules apply |
The RRIF % and RRIF $ columns make it easy to verify that actual withdrawals meet or exceed the legal minimum once RRIF rules take effect — from age 72 with the default conversion age, or earlier if you have set one.
The same export actions described in Section 7.4 are available here — right-click the table for Copy or Save as CSV/JSON, and right-click the chart for Copy to clipboard.
How RRSP/RRIF values are projected
- The RRSP balance starts from the current value entered in the Client edit form (see Section 6.5) and grows each year at the blended return rate (equity rate × allocation% + bond rate × remainder%).
- Annual contributions are added until the contribution end age.
- Voluntary withdrawals begin at the start age. All RRSP withdrawals are fully taxable as income.
- The RRSP is converted to a RRIF at the conversion age set for the strategy (see RRIF conversion age below). From the following year onward, mandatory minimum withdrawals are calculated each year using the CRA prescribed percentages based on the plan holder’s age (e.g. 5.28% at 72, 5.40% at 73, rising to 20.00% at age 95+). If the voluntary withdrawal amount is less than the RRIF minimum, the app increases the withdrawal to meet the legal requirement.
- The marker on the x-axis (highlighted in orange) indicates the first year RRIF minimums take effect.
RRIF conversion age
By default the app converts the RRSP to a RRIF at age 71 — the latest age the CRA allows — so mandatory minimum withdrawals begin at 72. You can change this per strategy using the RRIF withdrawals start at age field on the RRSP tab.
The field asks for the age at which RRIF treatment begins, so entering 68 means the account converts at 67 and the first mandatory minimum is withdrawn at 68. Accepted values run from 65 to 72; anything outside that range is clamped. There is no tax advantage to modelling a conversion before 65, and 72 is the latest first-withdrawal year the law permits.
Converting early is worth modelling when you want to:
- Start drawing taxable income sooner to smooth your marginal rate across retirement, rather than facing a sharp jump at 72
- Qualify for the pension income credit, which RRIF withdrawals attract from age 65 onward
- Reduce the RRSP balance before OAS begins, lowering exposure to the OAS clawback later
Changing this value affects every RRIF minimum-withdrawal calculation in the strategy, and the projection recalculates immediately.
Note: Converting early does not force larger withdrawals than the CRA minimum — it only starts the minimum schedule sooner. Because the prescribed percentage rises with age, an earlier conversion means smaller mandatory amounts spread over more years.
CRA reference: Canada.ca — Chart of prescribed factors (RRIF minimum withdrawals)
7.9 TFSA#
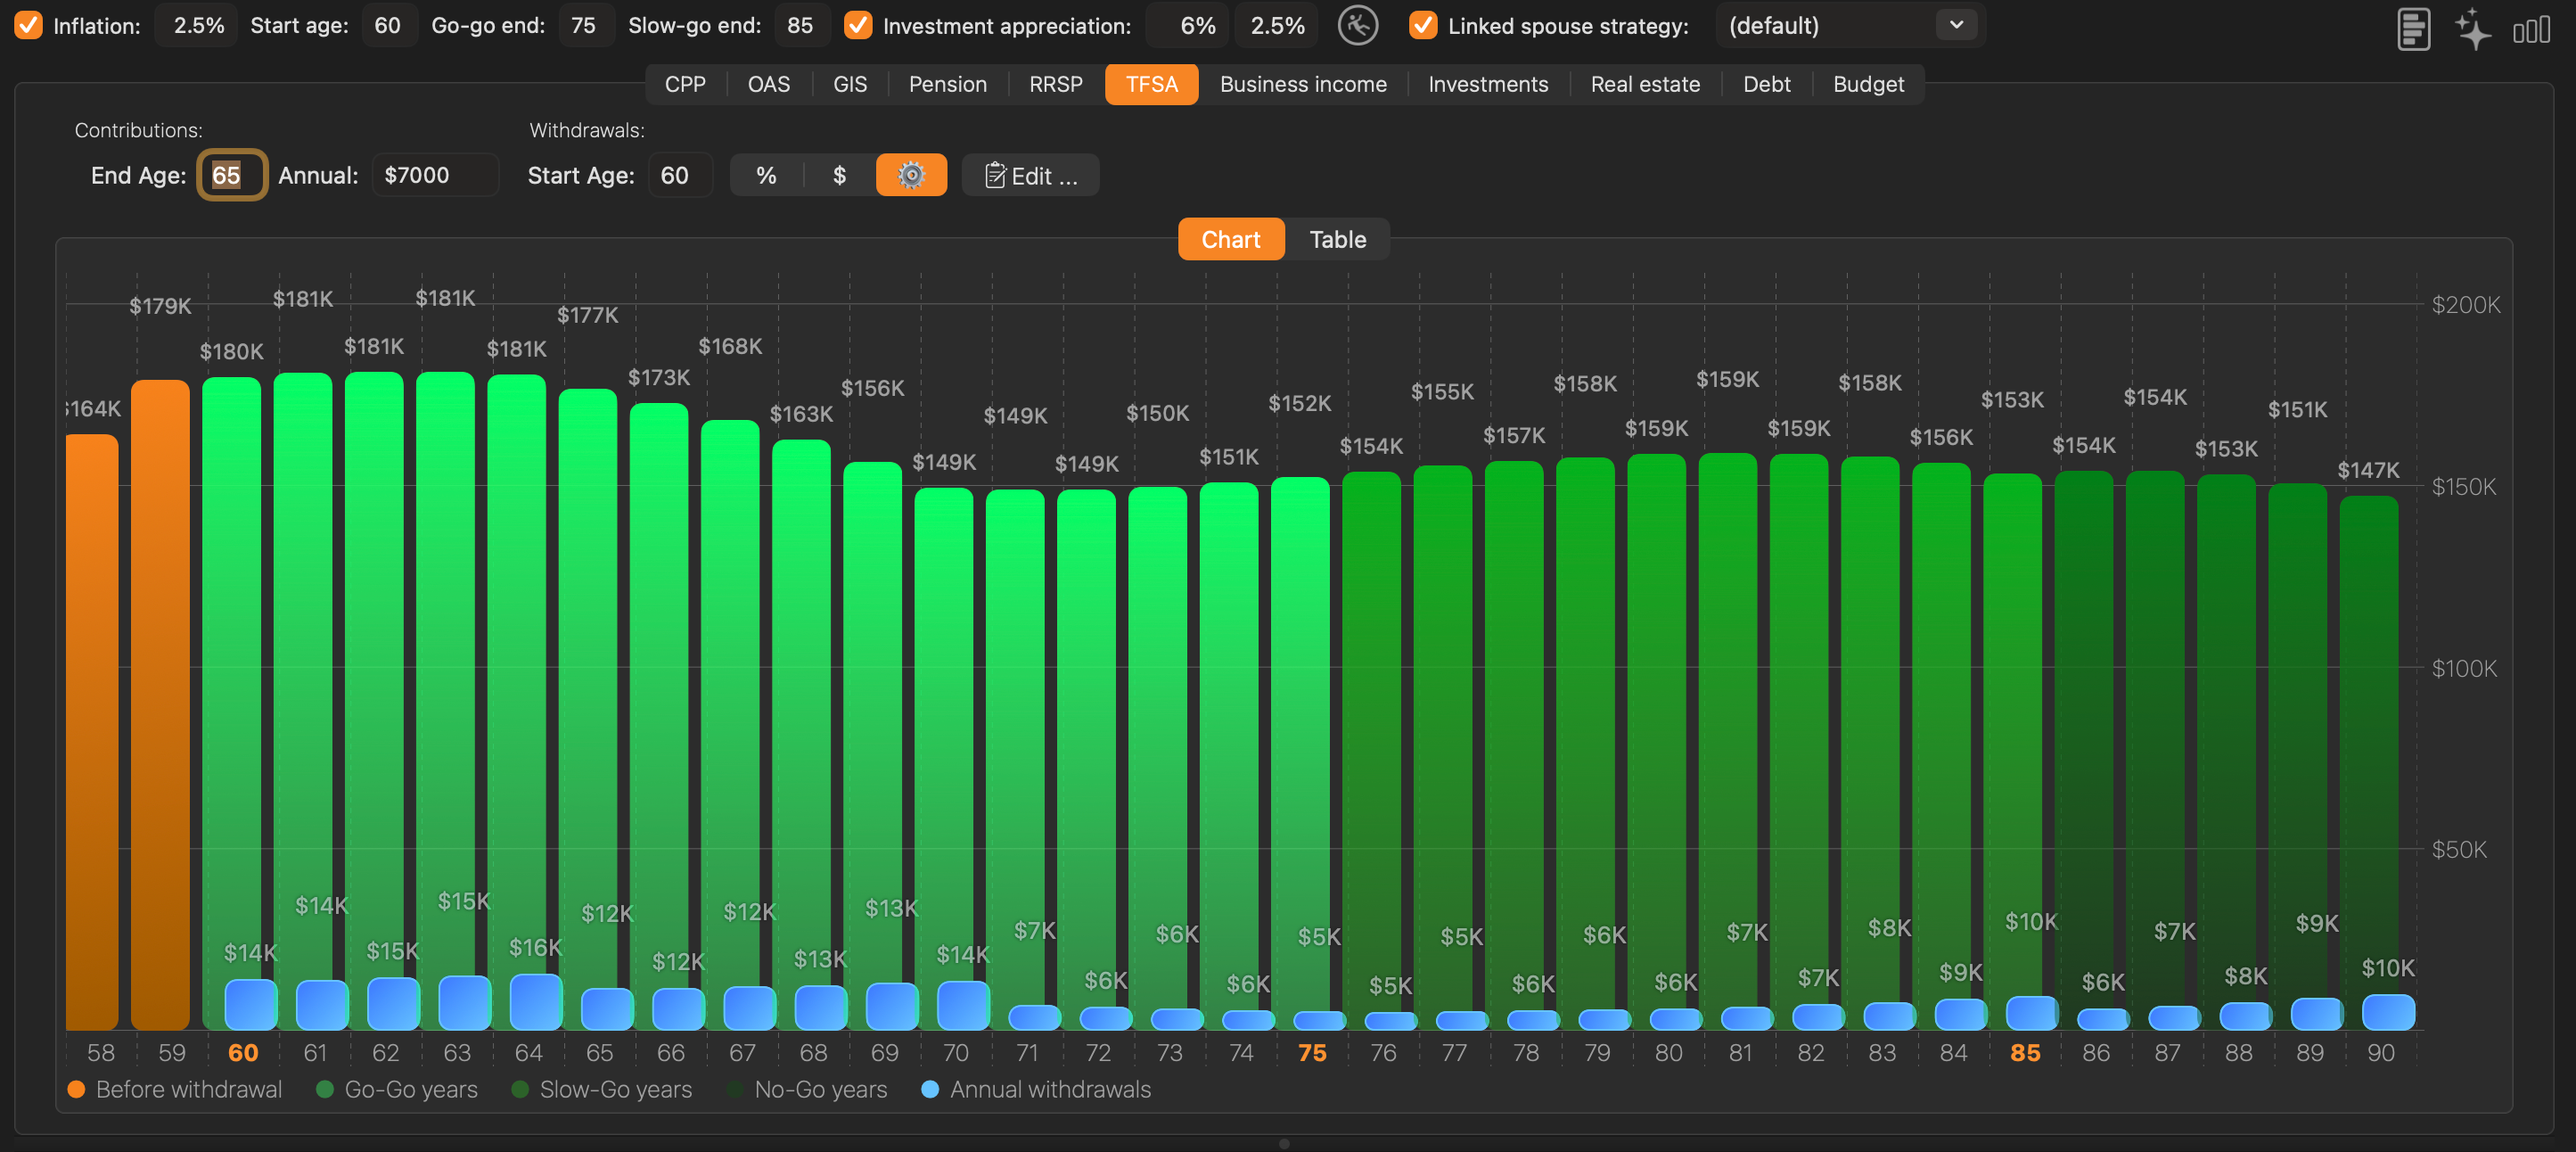
Controls
Identical in layout to the RRSP tab:
- Contributions: End Age and Annual — TFSA contributions.
- Withdrawals: Start Age — the age at which withdrawals begin.
- % / $ toggle — switches between percentage-of-balance and fixed-dollar withdrawal amounts. See Section 7.8 for a detailed explanation of each mode.
- Gear icon — activates custom withdrawals mode. When enabled, the app uses the per-age withdrawal schedule configured in the Edit dialog. When disabled, the app uses the % or $ amount uniformly or across the three Go-Go / Slow-Go / No-Go phases.
- Edit… button — opens the Retirement Plan Adjustments dialog for setting custom withdrawal amounts per individual age. The dialog works identically to the RRSP version described in Section 7.8, except there are no RRIF minimum constraints.
- Chart / Table — switches between the graphical chart view and a numeric table view.
Table view
The TFSA table has the following columns:
| Column | Description |
|---|---|
| Age | The client’s age for each row |
| Withdrawal | The dollar amount withdrawn from the TFSA at that age |
| Cumulative | The running total of all withdrawals taken up to that age |
| Balance | The projected account balance at the end of that year |
The same export actions described in Section 7.4 are available here — right-click the table for Copy or Save as CSV/JSON, and right-click the chart for Copy to clipboard.
How TFSA values are projected
- The TFSA balance starts from the current value entered in the Client edit form (see Section 6.6) and grows each year at the blended return rate based on the account’s stock-vs-bonds allocation.
- Annual contributions are added until the contribution end age. The current TFSA annual contribution limit is $7,000 (2024–2025).
- Withdrawals are entirely tax-free — they are not included in taxable income and do not affect means-tested benefits such as GIS or the OAS clawback.
- Unlike an RRSP/RRIF, there are no mandatory minimum withdrawals at any age.
CRA reference: Canada.ca — Tax-Free Savings Account
7.10 Business Income#
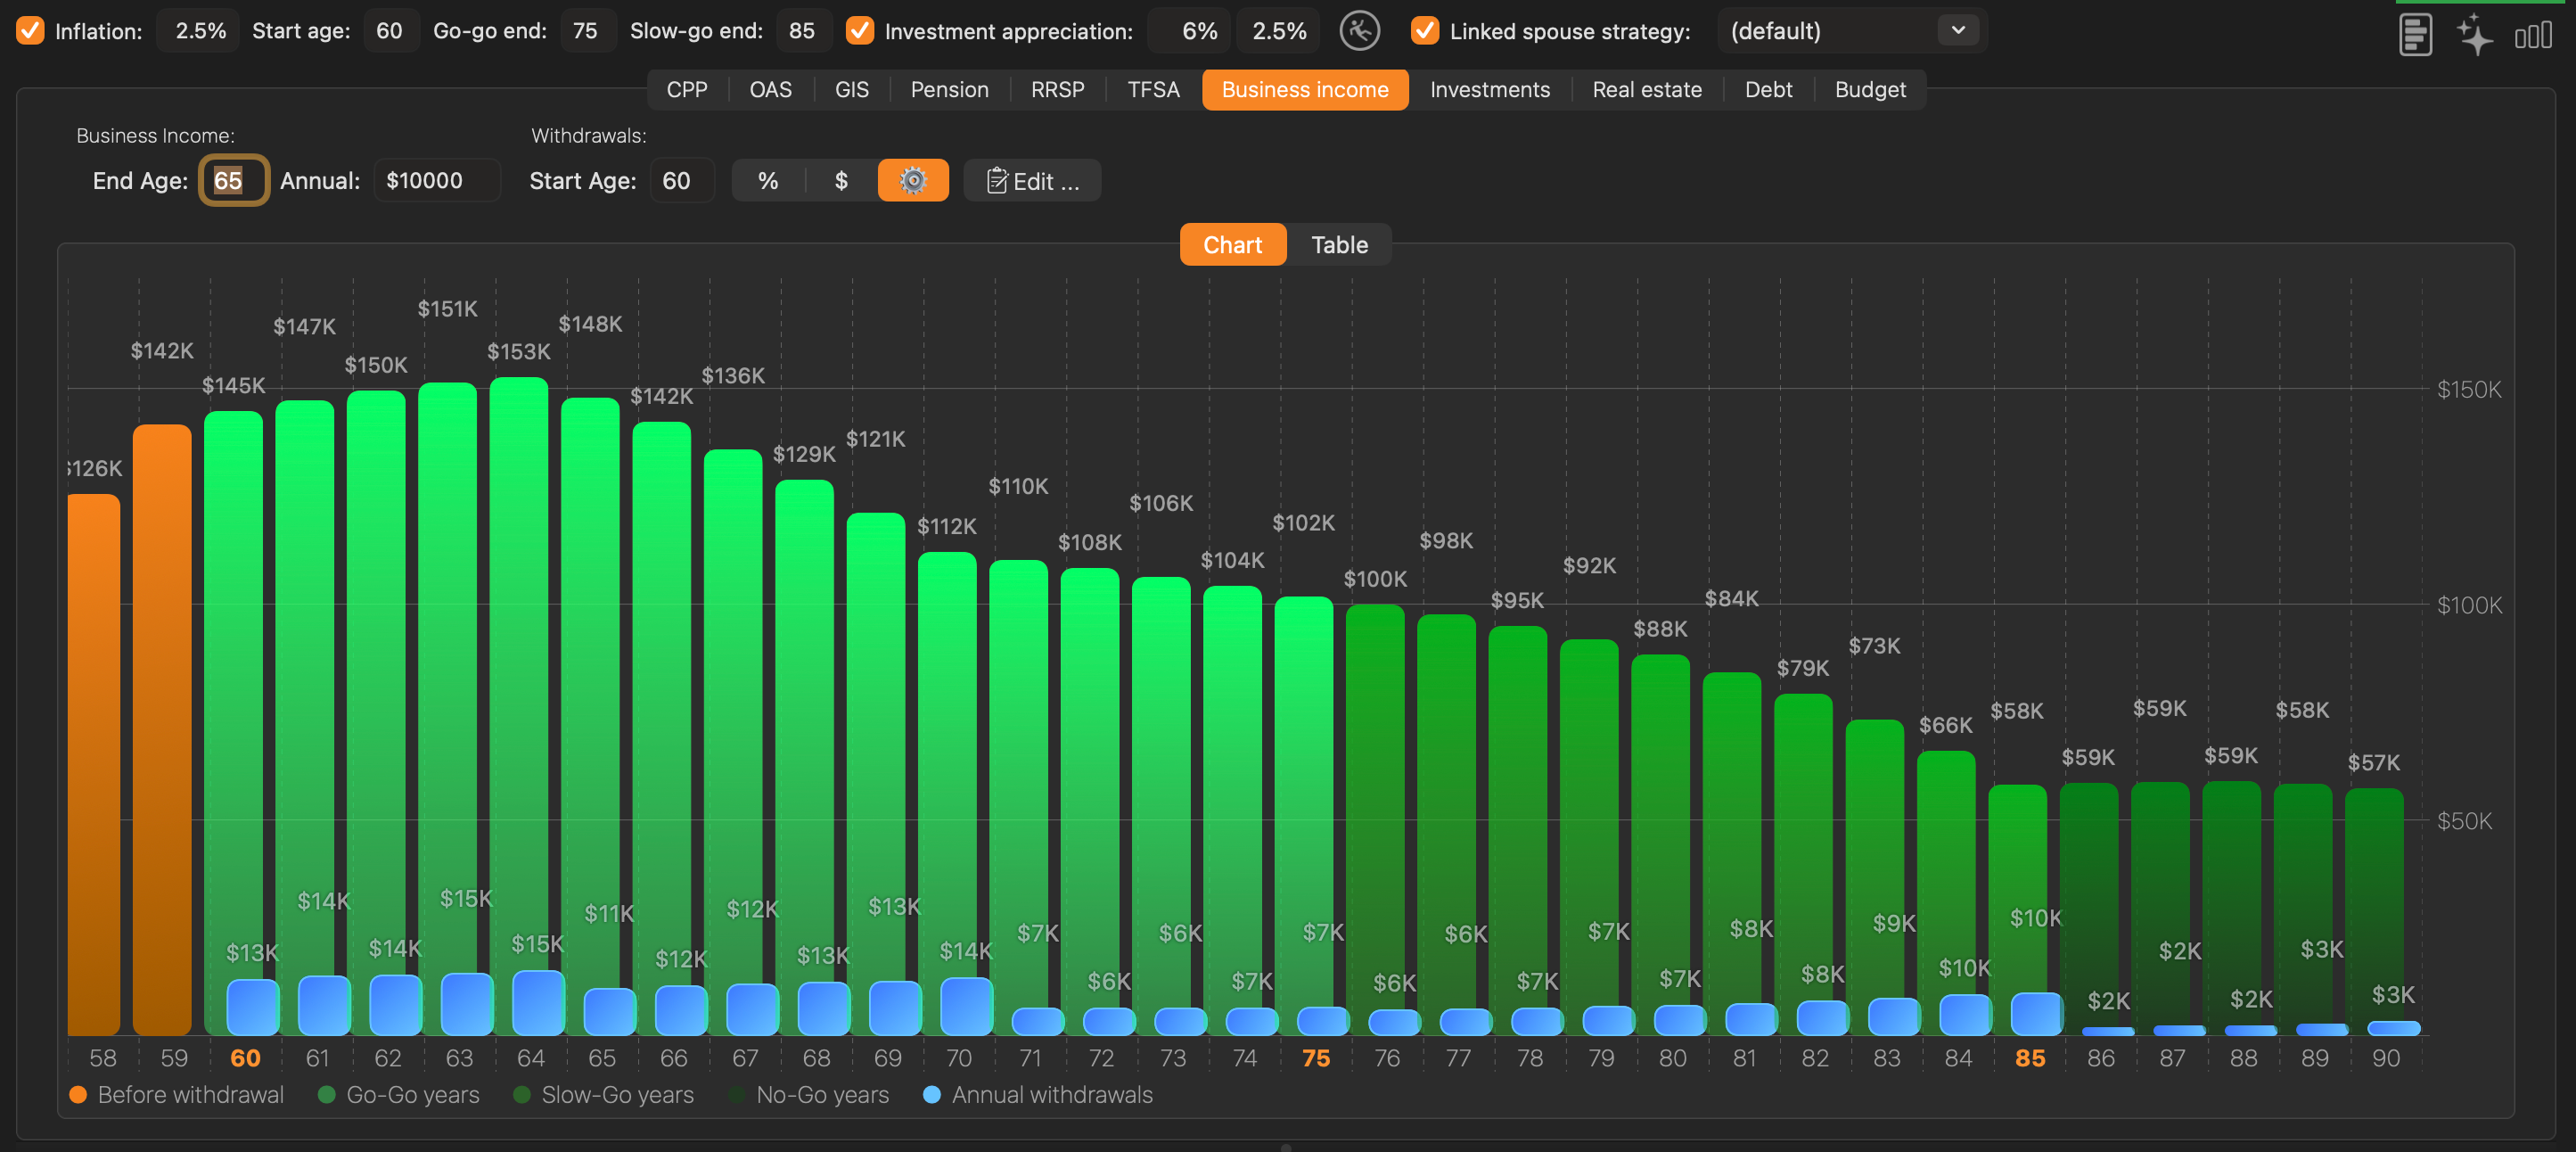
Controls
- Business Income: End Age — the last age at which active business income is earned.
- Business Income: Annual — the gross annual amount of business income during working years.
- Withdrawals: Start Age — the age at which withdrawals from residual business assets begin.
- % / $ toggle — switches between percentage-of-balance and fixed-dollar withdrawal amounts. See Section 7.8 for a detailed explanation of each mode.
- Gear icon — activates custom withdrawals mode. When enabled, the app uses the per-age withdrawal schedule configured in the Edit dialog. When disabled, the app uses the % or $ amount uniformly or across the three Go-Go / Slow-Go / No-Go phases.
- Edit… button — opens the Retirement Plan Adjustments dialog for setting custom withdrawal amounts per individual age. Works identically to the RRSP version described in Section 7.8.
- Chart / Table — switches between the graphical chart view and a numeric table view.
Table view
The Business income table has the following columns:
| Column | Description |
|---|---|
| Age | The client’s age for each row |
| Withdrawal | The dollar amount withdrawn from the business account at that age |
| Cumulative | The running total of all withdrawals taken up to that age |
| Balance | The projected business investment balance at the end of that year |
The same export actions described in Section 7.4 are available here — right-click the table for Copy or Save as CSV/JSON, and right-click the chart for Copy to clipboard.
How business income is projected
- The business investment balance starts from the current value entered in the Client edit form (see Section 6.7).
- Active business income (the annual amount) is added until the end age. The balance grows at the blended return rate based on the stock-vs-bonds allocation.
- After the end age, no new income is added but the balance continues to grow and withdrawals are taken per the configured schedule.
- Capital gains on liquidation are estimated using the Adjusted Cost Base (ACB) entered in the Client edit form.
- Business income is fully taxable as income in the year received.
7.11 Investments#
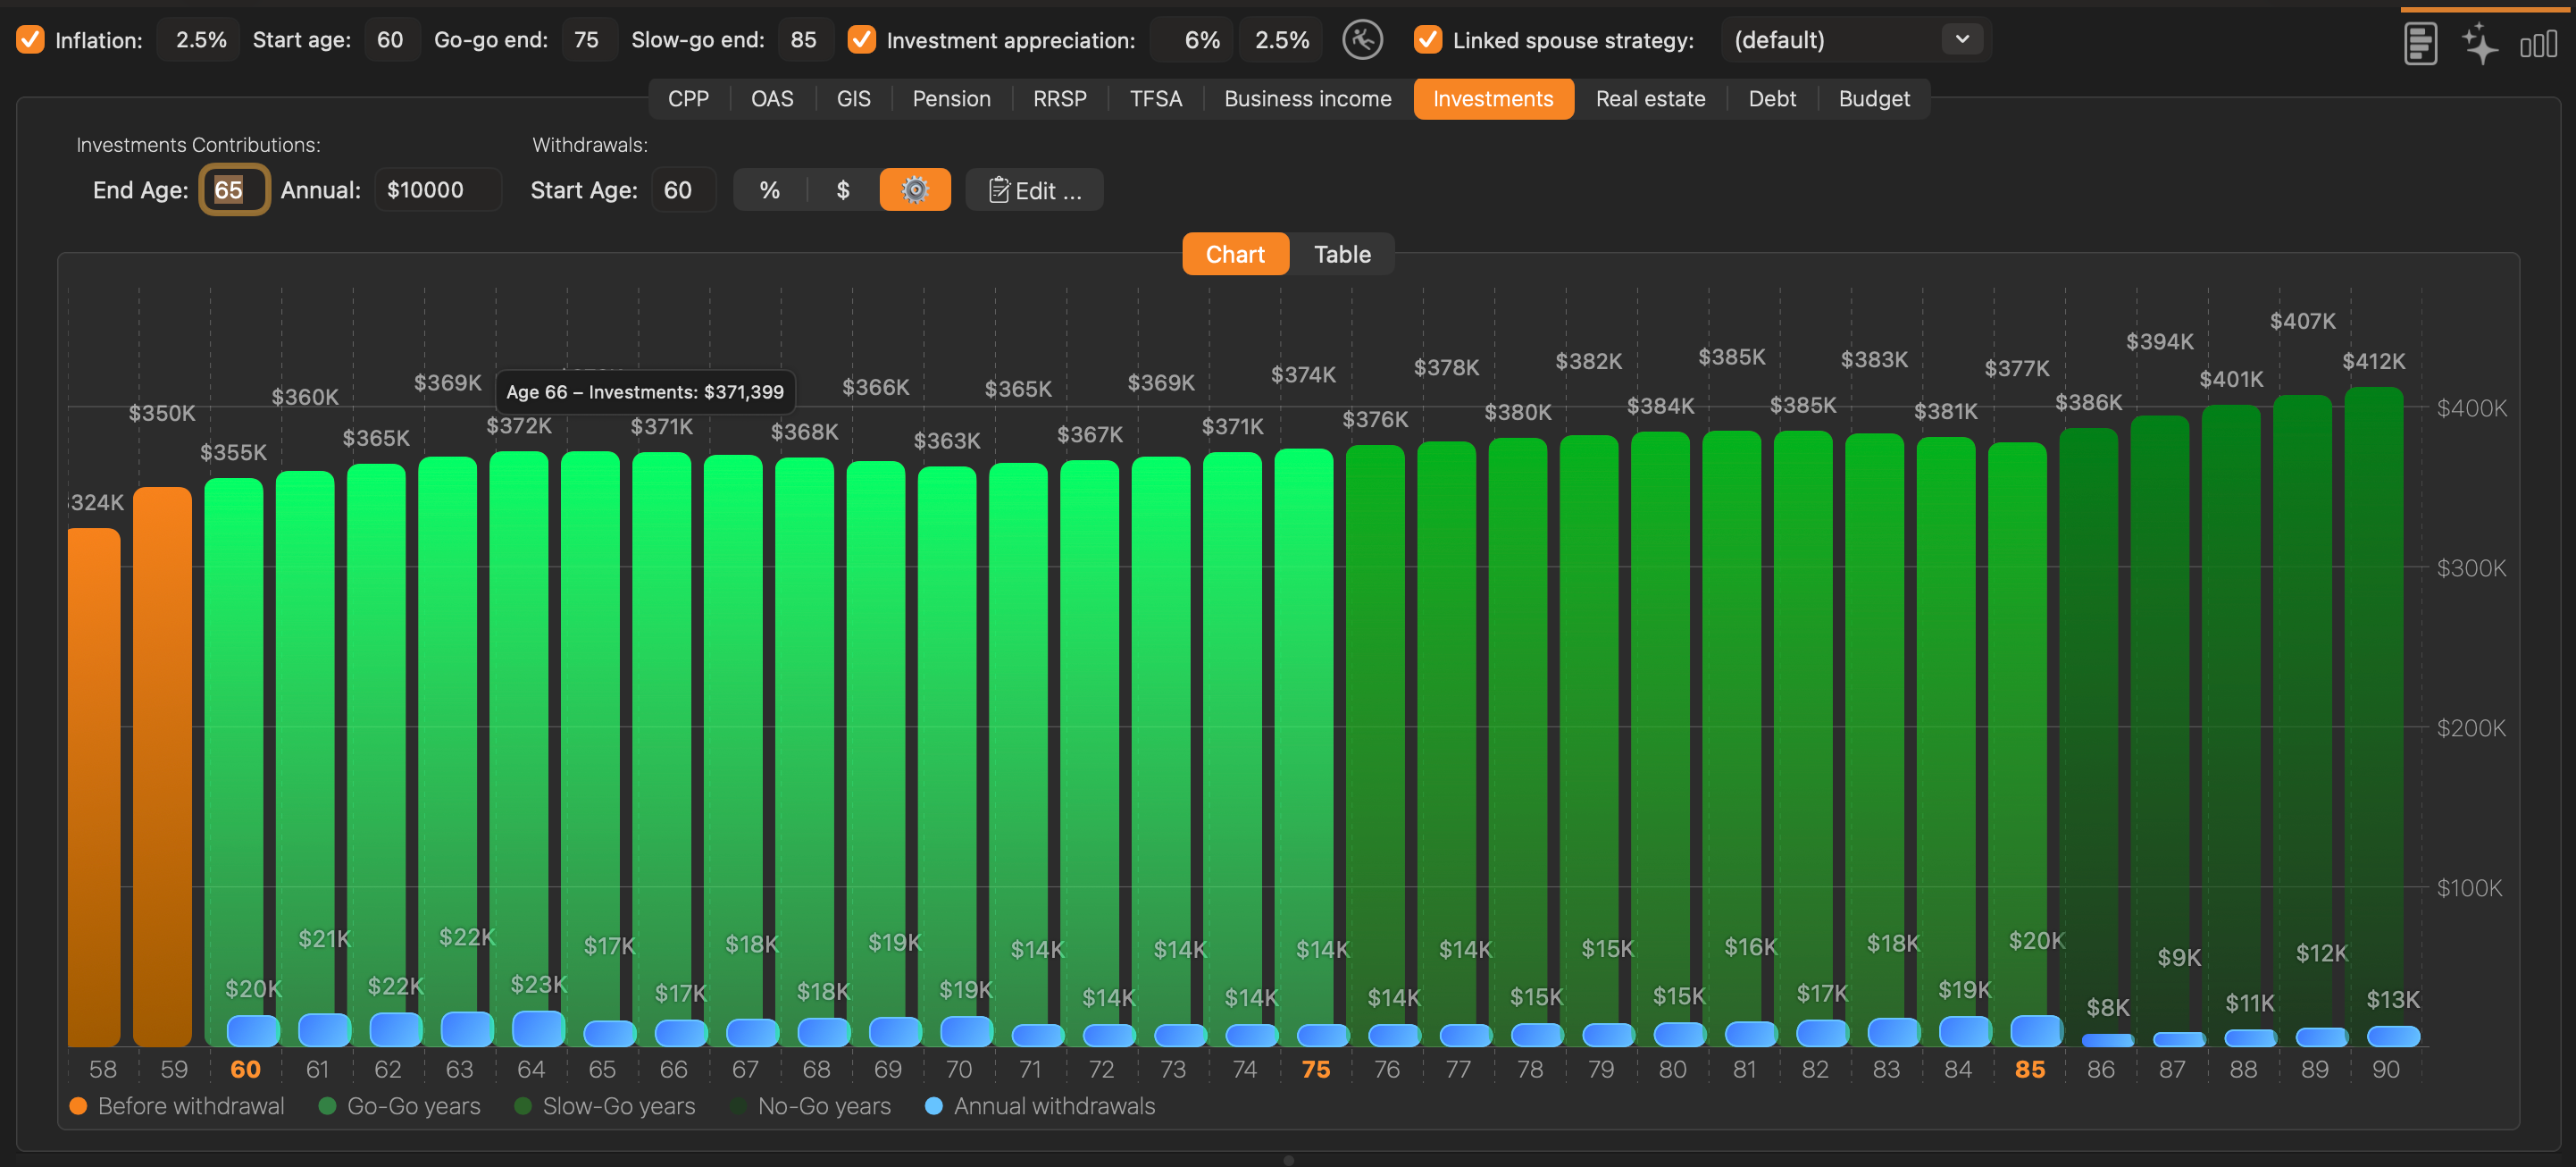
Controls
- Investments Contributions: End Age — the last age at which new contributions are made to the non-registered portfolio.
- Investments Contributions: Annual — the dollar amount contributed each year.
- Withdrawals: Start Age — the age at which withdrawals begin.
- % / $ toggle — switches between percentage-of-balance and fixed-dollar withdrawal amounts. See Section 7.8 for a detailed explanation of each mode.
- Gear icon — activates custom withdrawals mode. When enabled, the app uses the per-age withdrawal schedule configured in the Edit dialog. When disabled, the app uses the % or $ amount uniformly or across the three Go-Go / Slow-Go / No-Go phases.
- Edit… button — opens the Retirement Plan Adjustments dialog for setting custom withdrawal amounts per individual age. Works identically to the RRSP version described in Section 7.8.
- Chart / Table — switches between the graphical chart view and a numeric table view.
Table view
The Investments table has the following columns:
| Column | Description |
|---|---|
| Age | The client’s age for each row |
| Withdrawal | The dollar amount withdrawn from the non-registered portfolio at that age |
| Cumulative | The running total of all withdrawals taken up to that age |
| Balance | The projected portfolio balance at the end of that year |
The same export actions described in Section 7.4 are available here — right-click the table for Copy or Save as CSV/JSON, and right-click the chart for Copy to clipboard.
How non-registered investment values are projected
- The portfolio balance starts from the current value entered in the Client edit form (see Section 6.8).
- The balance grows at the blended return rate (equity rate × allocation% + bond rate × remainder%).
- Capital gains realized on withdrawals are estimated using the Adjusted Cost Base (ACB). In Canada, 50% of realized capital gains are included in taxable income (the capital gains inclusion rate — note: this rate may change based on federal legislation; the app uses the rate in the current tax parameters file).
- Dividend income and interest income from the portfolio are taxed at the applicable rates.
CRA reference: Canada.ca — Line 12700, Taxable capital gains
7.12 Real Estate#
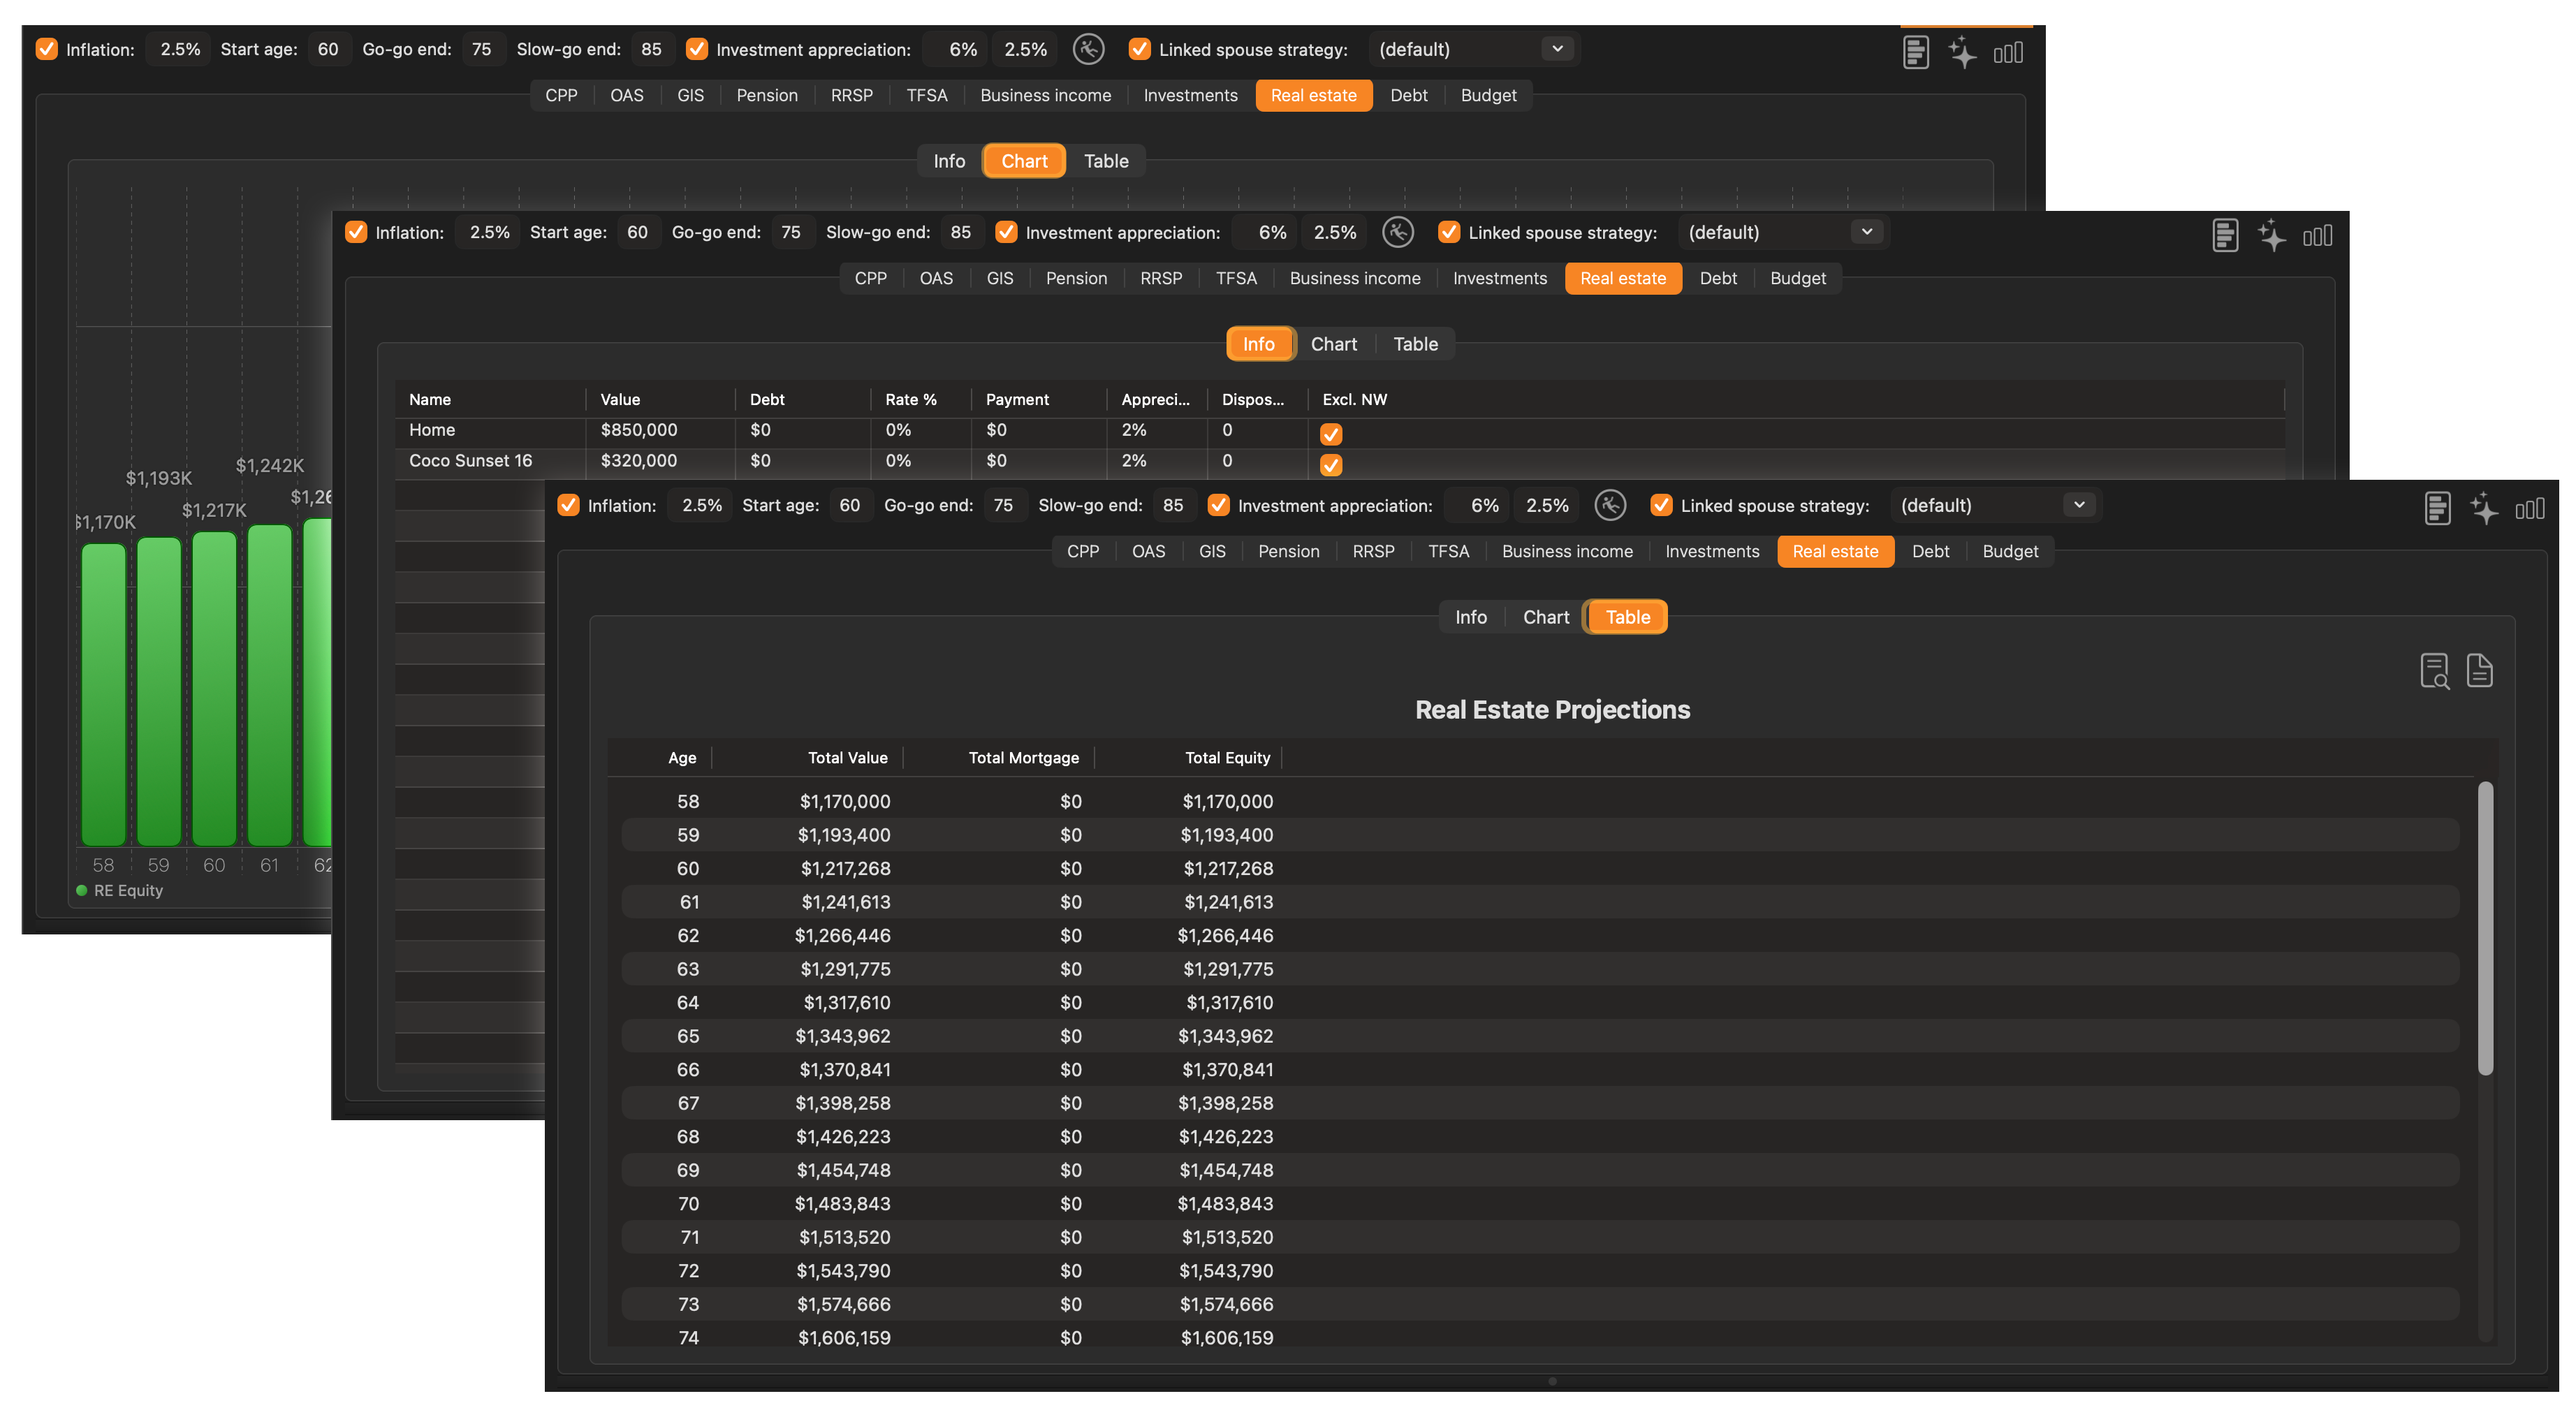
Sub-tabs
- Info — displays the property details entered in the Client edit form (see Section 6.9).
- Chart — shows projected real estate equity over time (current value minus remaining mortgage, growing at the appreciation rate).
- Table — year-by-year numeric breakdown.
Table view
The Real Estate table has the following columns:
| Column | Description |
|---|---|
| Age | The client’s age for each row |
| Total Value | The projected combined market value of all properties at that age |
| Total Mortgage | The total remaining mortgage balance across all properties at that age |
| Total Equity | Net equity — Total Value minus Total Mortgage |
The same export actions described in Section 7.4 are available here — right-click the table for Copy or Save as CSV/JSON, and right-click the chart for Copy to clipboard.
How real estate values are projected
- Each property’s value grows annually at its configured appreciation rate.
- The mortgage balance is reduced each year based on the monthly payment and interest rate until the debt is paid off.
- Net equity = property value − remaining mortgage.
- If a disposal age is set for a property, it is “sold” at that age and the net proceeds (sale value minus remaining mortgage) are added to the investment portfolio.
- The principal residence exemption is assumed for properties designated as the client’s home, exempting the gain from capital gains tax. Investment properties trigger capital gains tax on the accrued gain at disposal.
- Properties marked as Exclude from Net Worth are not included in the net worth chart.
7.13 Debt#
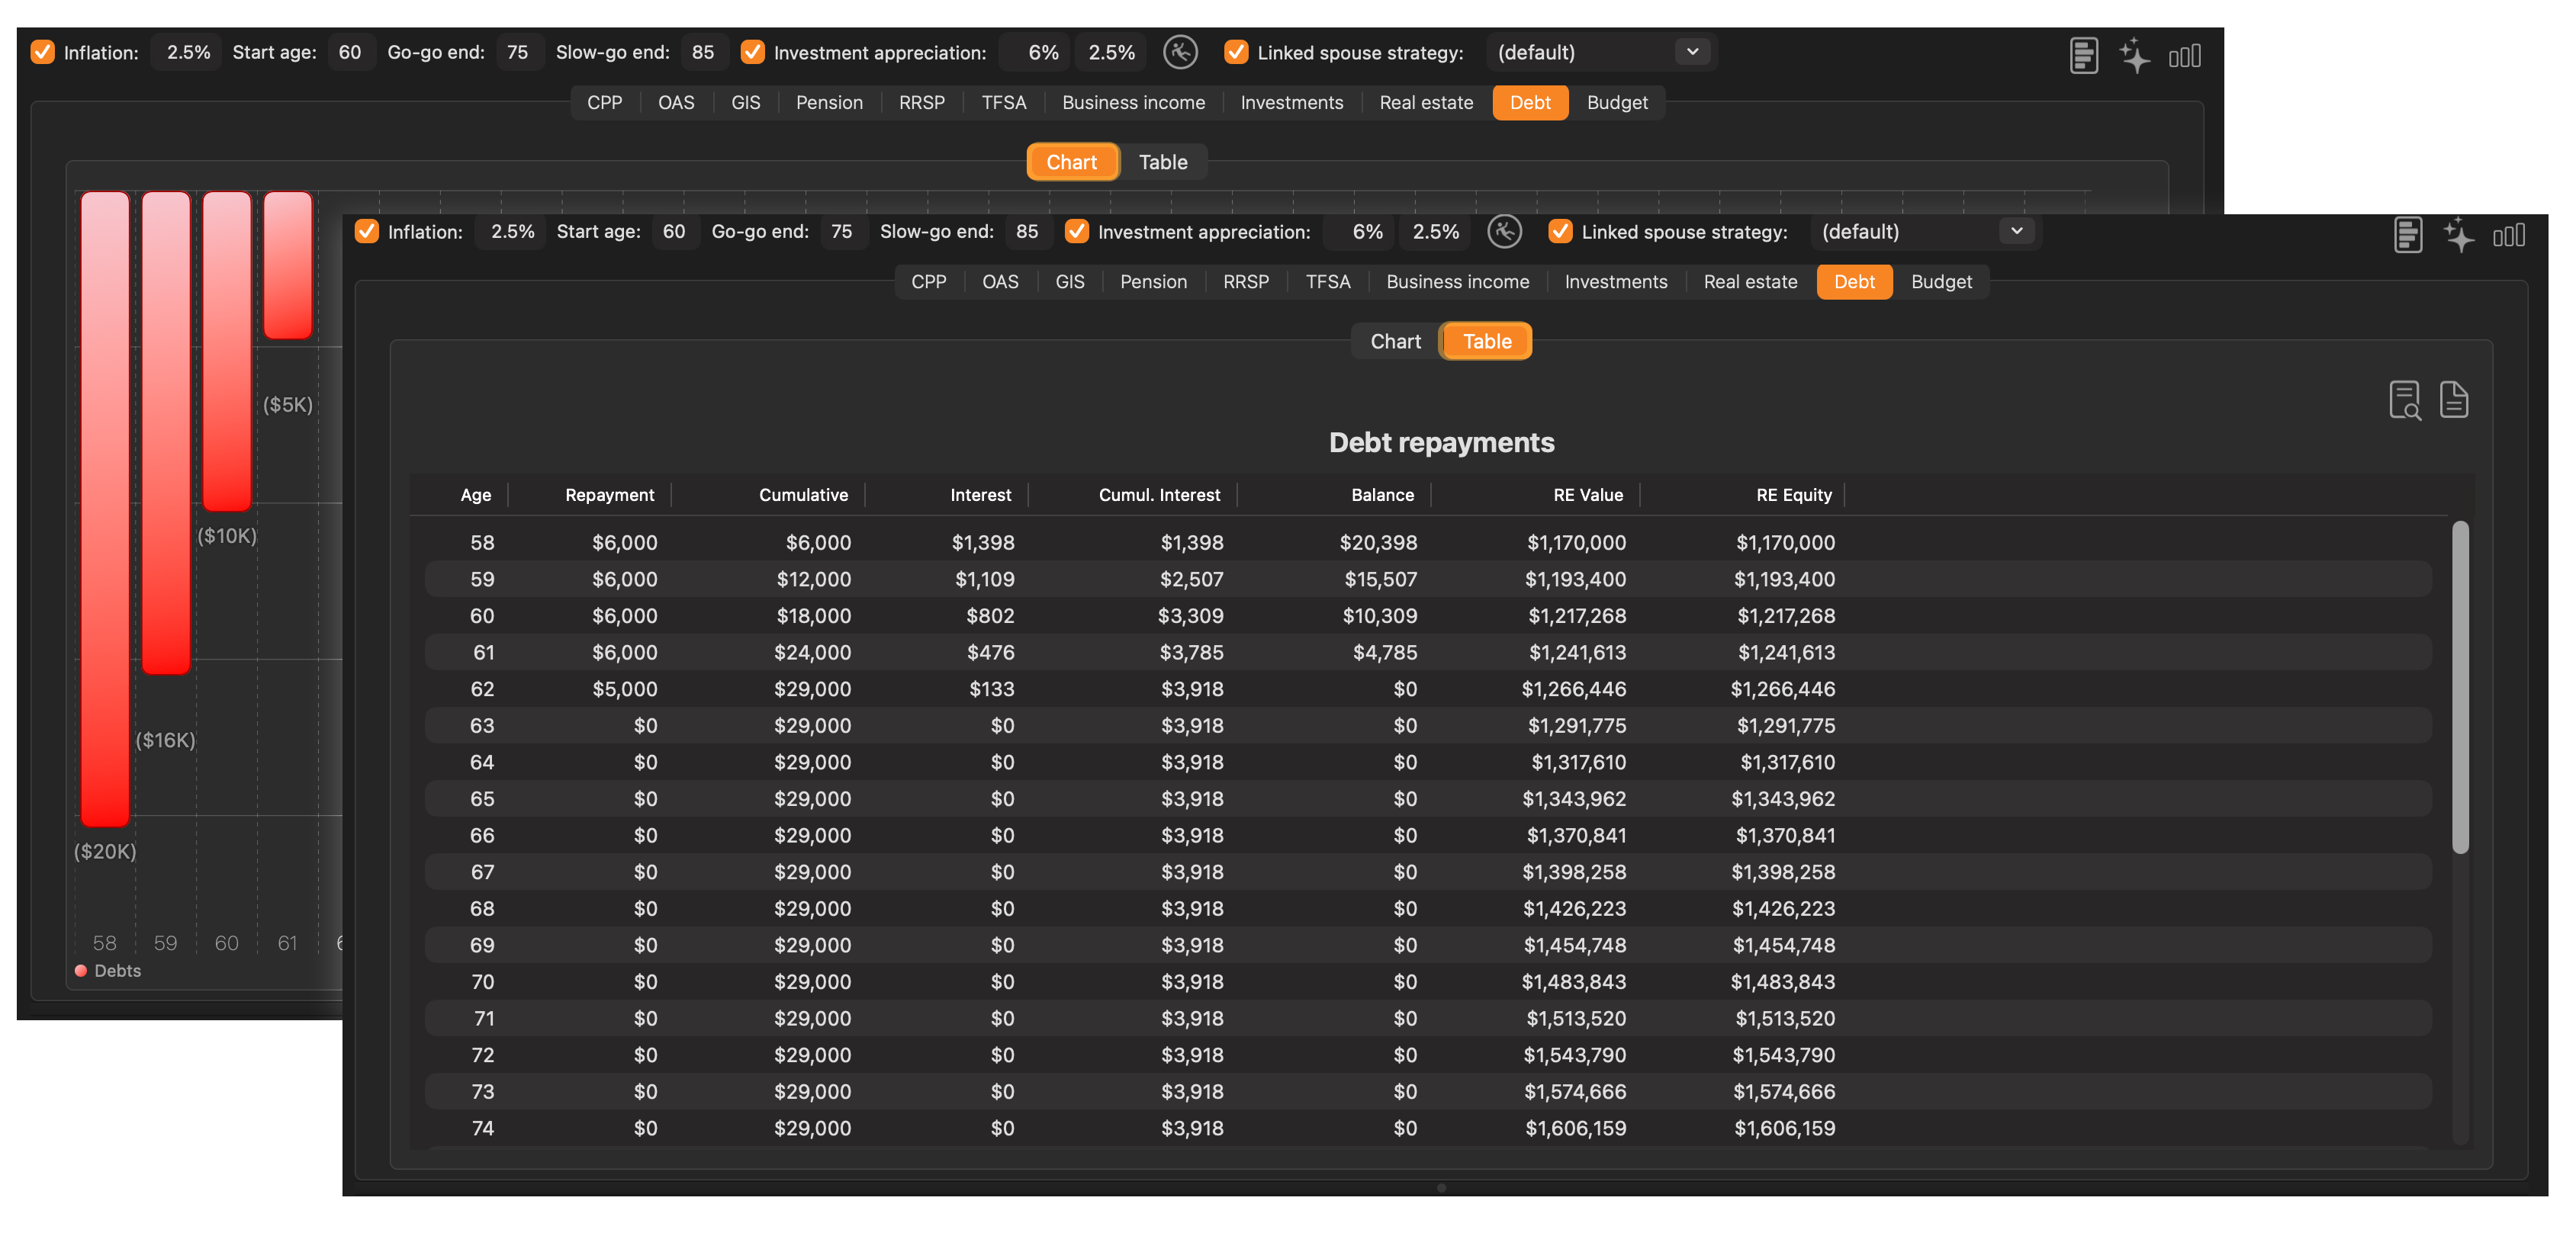
Sub-tabs
- Chart — shows remaining debt balances as red bars, declining each year as payments are made. Once all debts are paid off, the chart shows zero.
- Table — year-by-year numeric breakdown of each debt’s remaining balance.
Table view
The Debt table has the following columns:
| Column | Description |
|---|---|
| Age | The client’s age for each row |
| Repayment | The total debt principal repaid that year across all debts |
| Cumulative | The running total of all principal repayments made up to that age |
| Interest | The total interest paid across all debts that year |
| Cumul. Interest | The running total of all interest paid up to that age |
| Balance | The total remaining debt balance across all debts at the end of that year |
| RE Value | The combined market value of all real estate properties at that age |
| RE Equity | The net real estate equity (RE Value minus remaining mortgage) at that age |
The inclusion of RE Value and RE Equity alongside debt data provides a direct view of how net real estate equity compares to outstanding debt at each age.
The same export actions described in Section 7.4 are available here — right-click the table for Copy or Save as CSV/JSON, and right-click the chart for Copy to clipboard.
How debts are projected
- Each debt’s balance is reduced annually based on its monthly payment and interest rate.
- The app calculates how many years it takes for each debt to reach zero. After payoff, the monthly payment is freed up and no longer deducted from the client’s cash flow.
- Outstanding debt balances are subtracted from the client’s net worth at each age.
7.14 Budget#
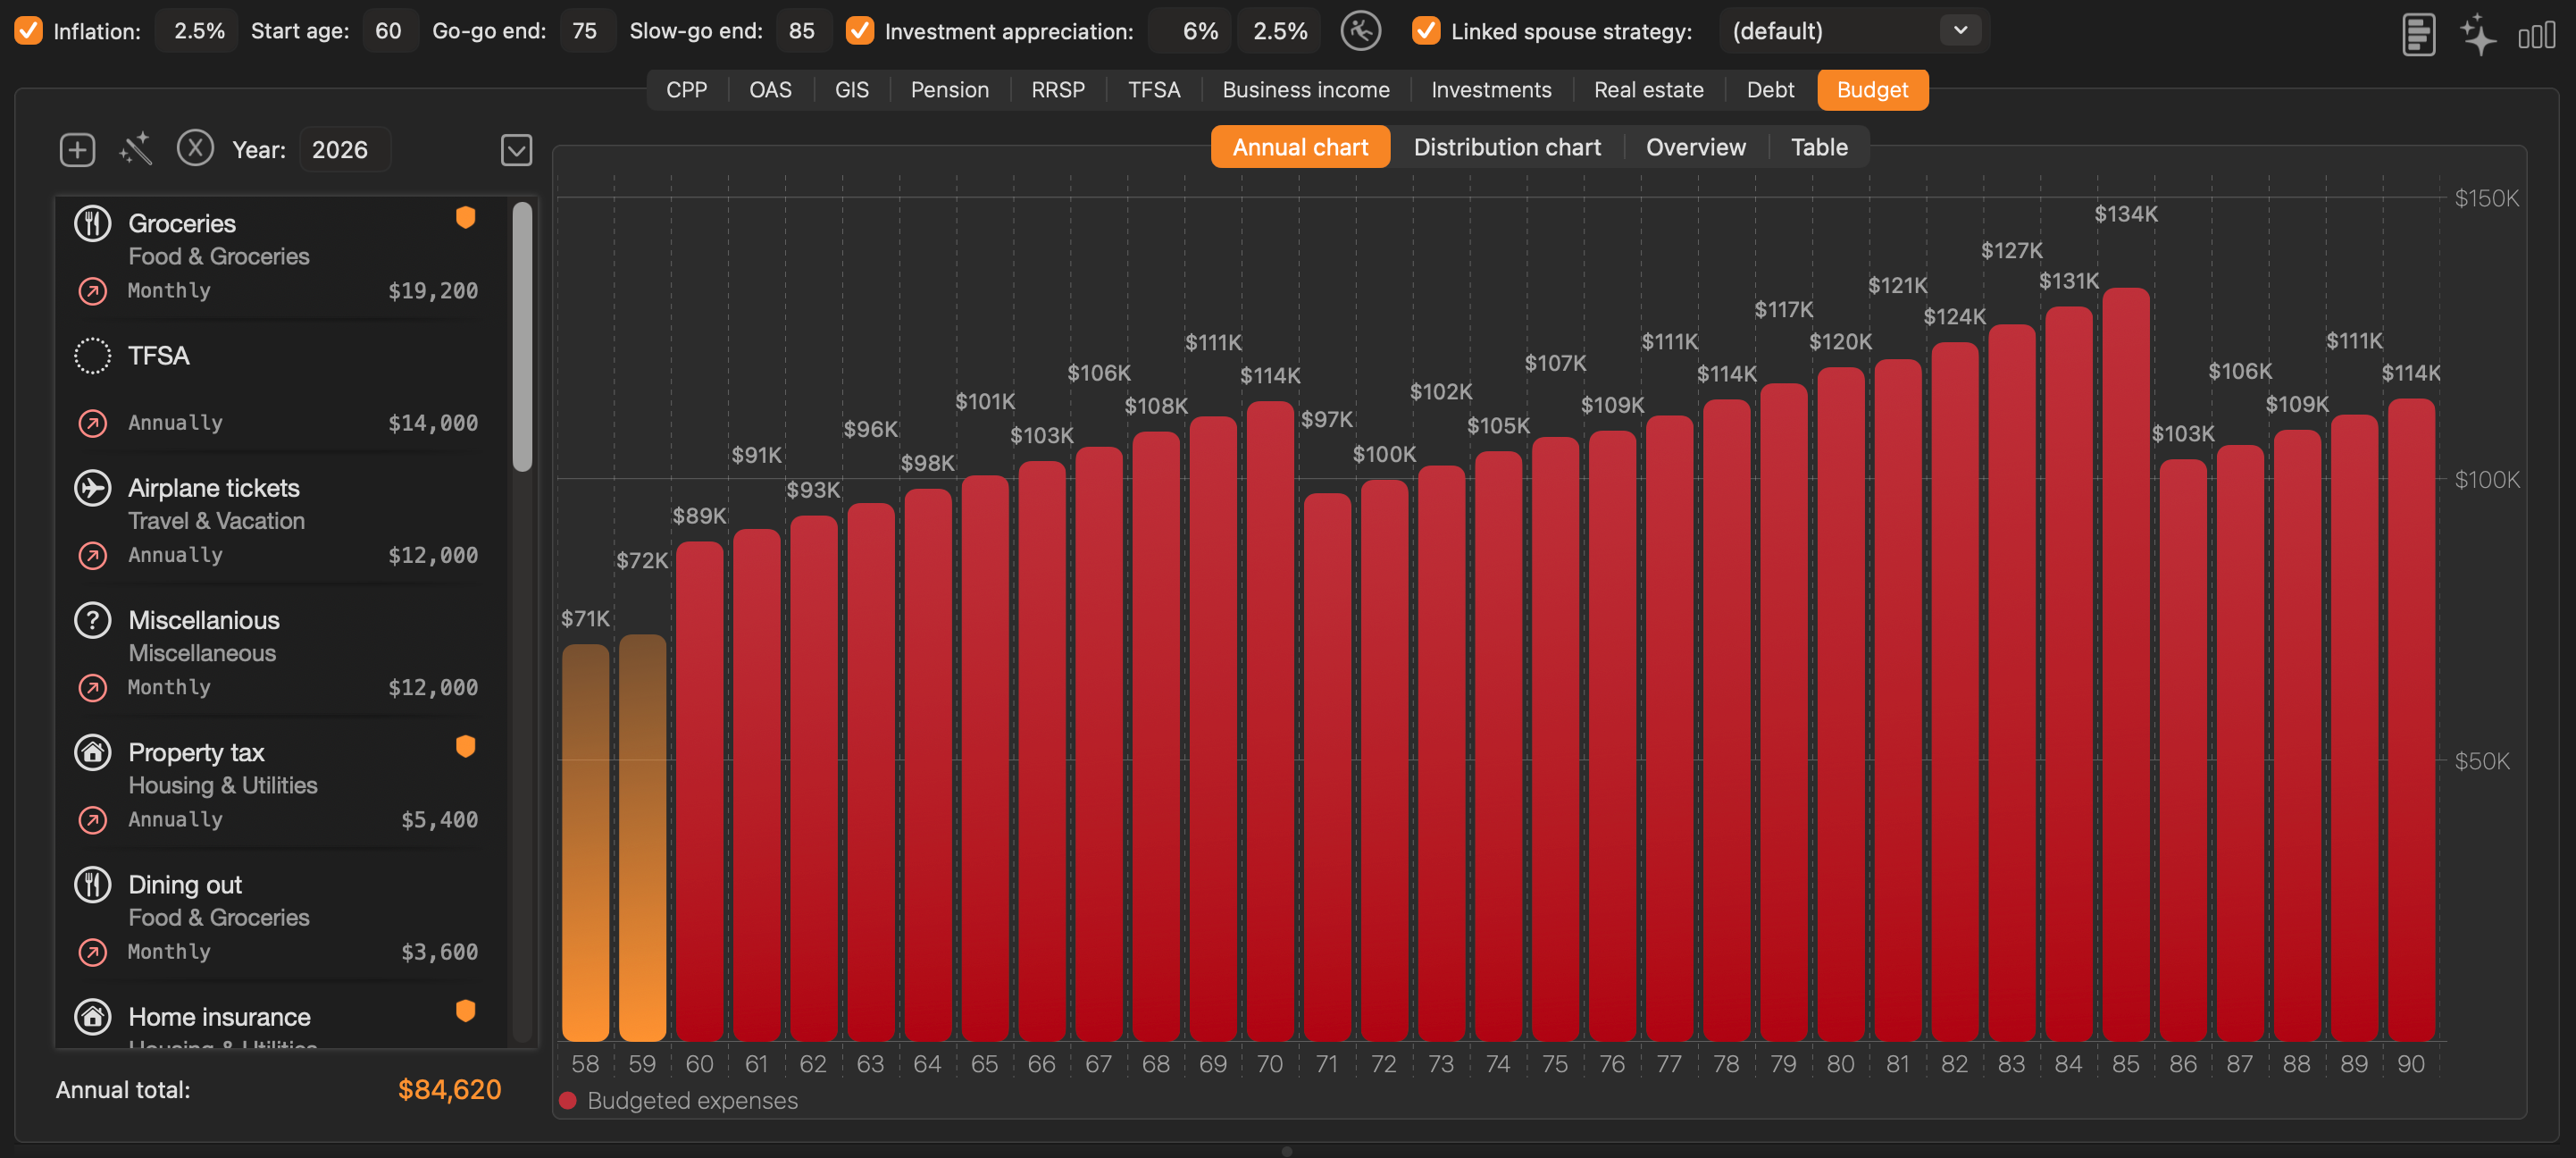
Budget item list (left panel)
The left side of the Budget tab displays the client’s itemized budget — their projected annual expenses during retirement. Each item shows:
- Name — a descriptive label (e.g. “Groceries”, “Property tax”)
- Category — a grouping such as Food & Groceries, Housing & Utilities, Travel & Vacation, or Miscellaneous
- Frequency — whether the amount is entered as Monthly or Annually
- Amount — the monthly or annual cost
Items flagged with a yellow dot are set to be adjusted for inflation over time.
Use the + button at the bottom to add items and the trash button to remove the selected item. The Annual total at the bottom shows the sum of all items converted to annual amounts.
Editing a budget item
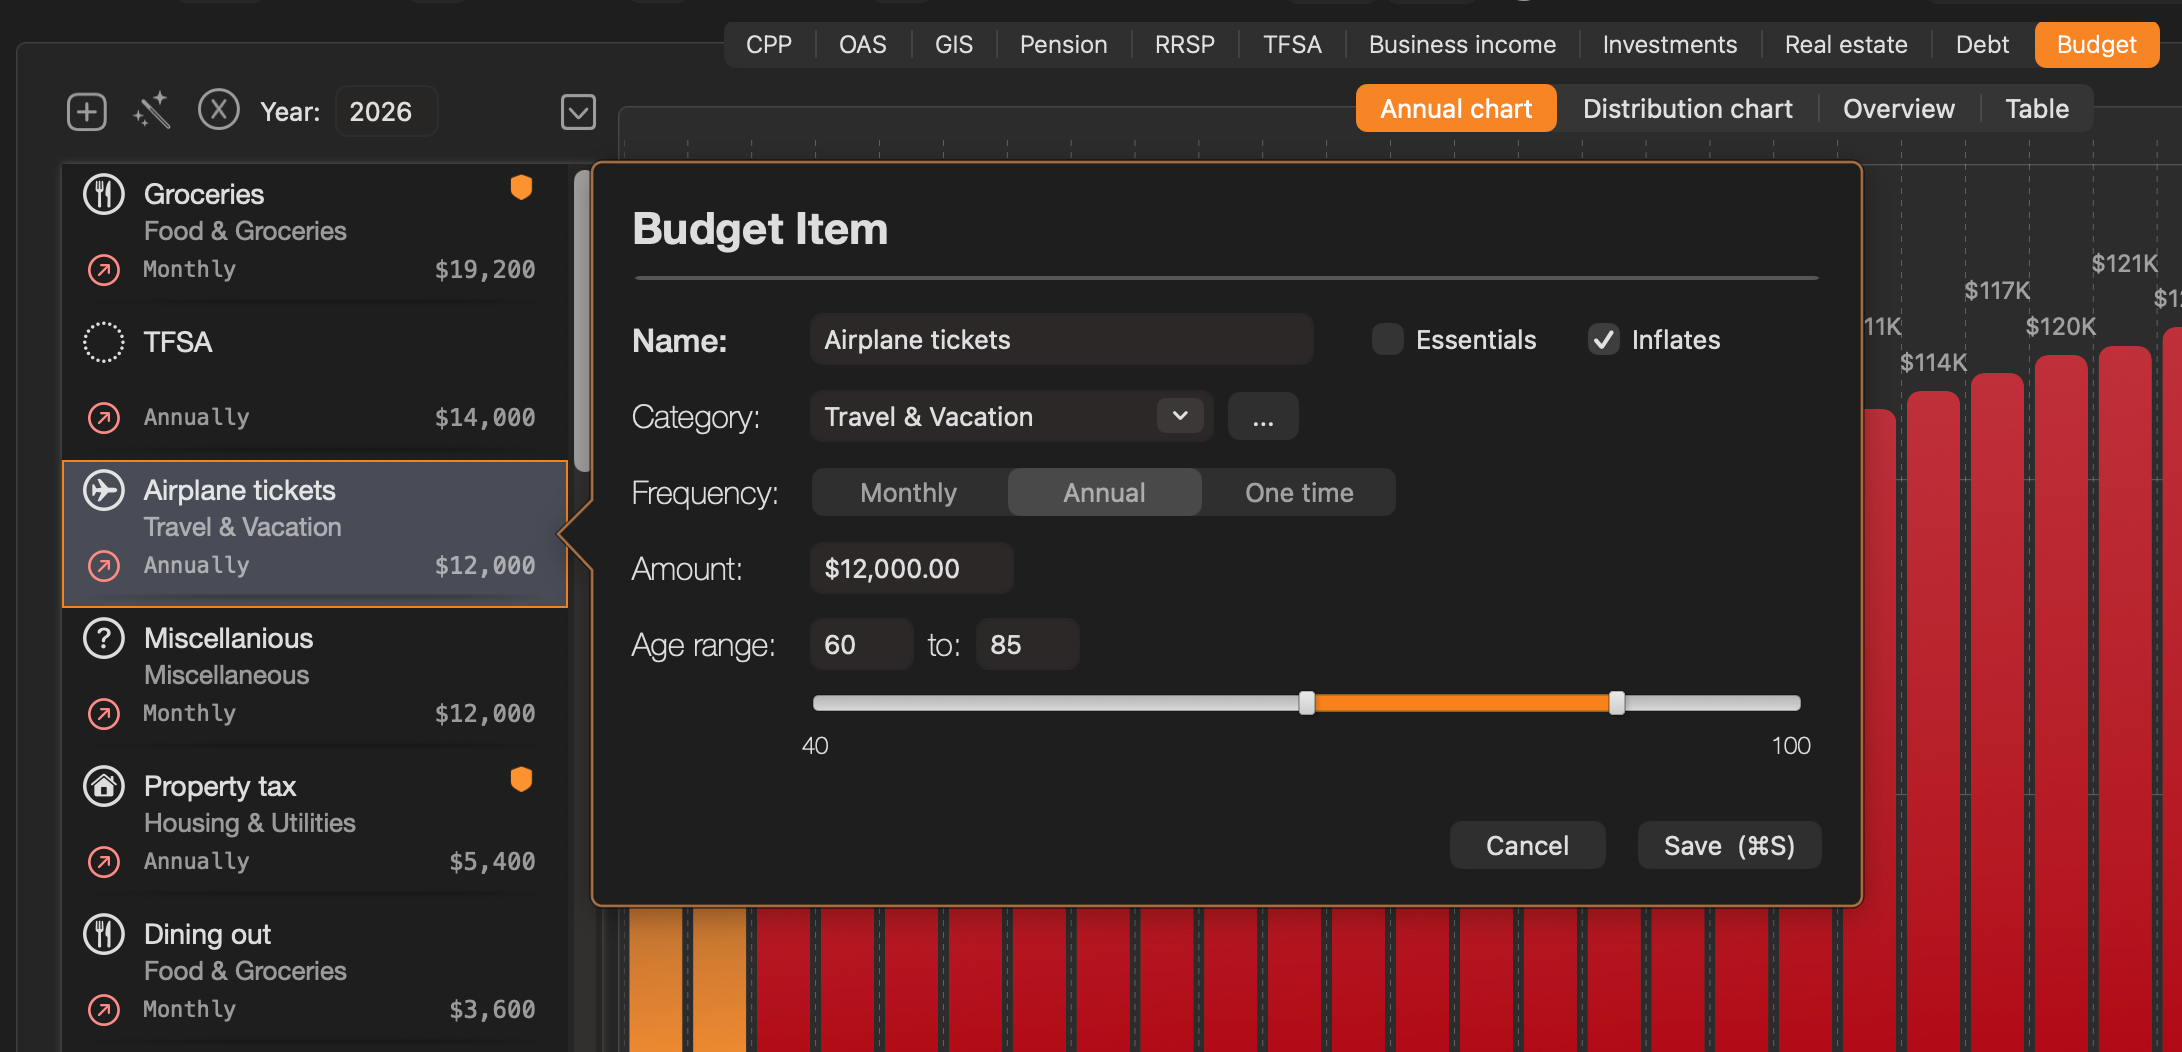
Double-click any item in the list (or click the + button to create a new one) to open the Budget Item edit dialog. The fields are:
- Name — a free-text label for the expense (e.g. “Groceries”, “Home insurance”).
- Essentials — check this box to mark the item as an essential expense. Essential items are used in the Budget Distribution and Table sub-tabs to separate must-have spending from discretionary spending.
- Inflates — check this box to apply the strategy’s inflation rate to this item each year. Items such as groceries and property tax typically inflate; one-time purchases or fixed-rate items do not.
- Category — the spending category (e.g. Food & Groceries, Housing & Utilities, Travel & Vacation, Transportation). Click the … button to open the full category picker and choose from the available categories.
- Frequency — a three-way segment control:
- Monthly — the Amount field is interpreted as a monthly cost; the app multiplies by 12 to compute the annual budget.
- Annual — the Amount field is the full annual cost.
- One time — the expense occurs only in the single year defined by the Age range. Useful for modelling one-off costs such as a vehicle purchase or home renovation.
- Amount — the dollar value of the expense, in the units defined by the Frequency setting.
- Age range — a two-handle slider defining the ages over which this item is active. Drag the left handle to set the start age and the right handle to set the end age. Items outside this range contribute $0 to the budget in those years.
Click Save to apply the changes or Cancel to discard them.
Sub-tabs (right panel)
Annual chart
The Annual chart sub-tab shows total budgeted expenses as a bar chart, plotted from the strategy start age to the expected lifespan. Bars grow over time for items that have the Inflates flag set. This chart is the budget target line used by the Stress Test to determine whether after-tax income meets spending goals.
Distribution chart
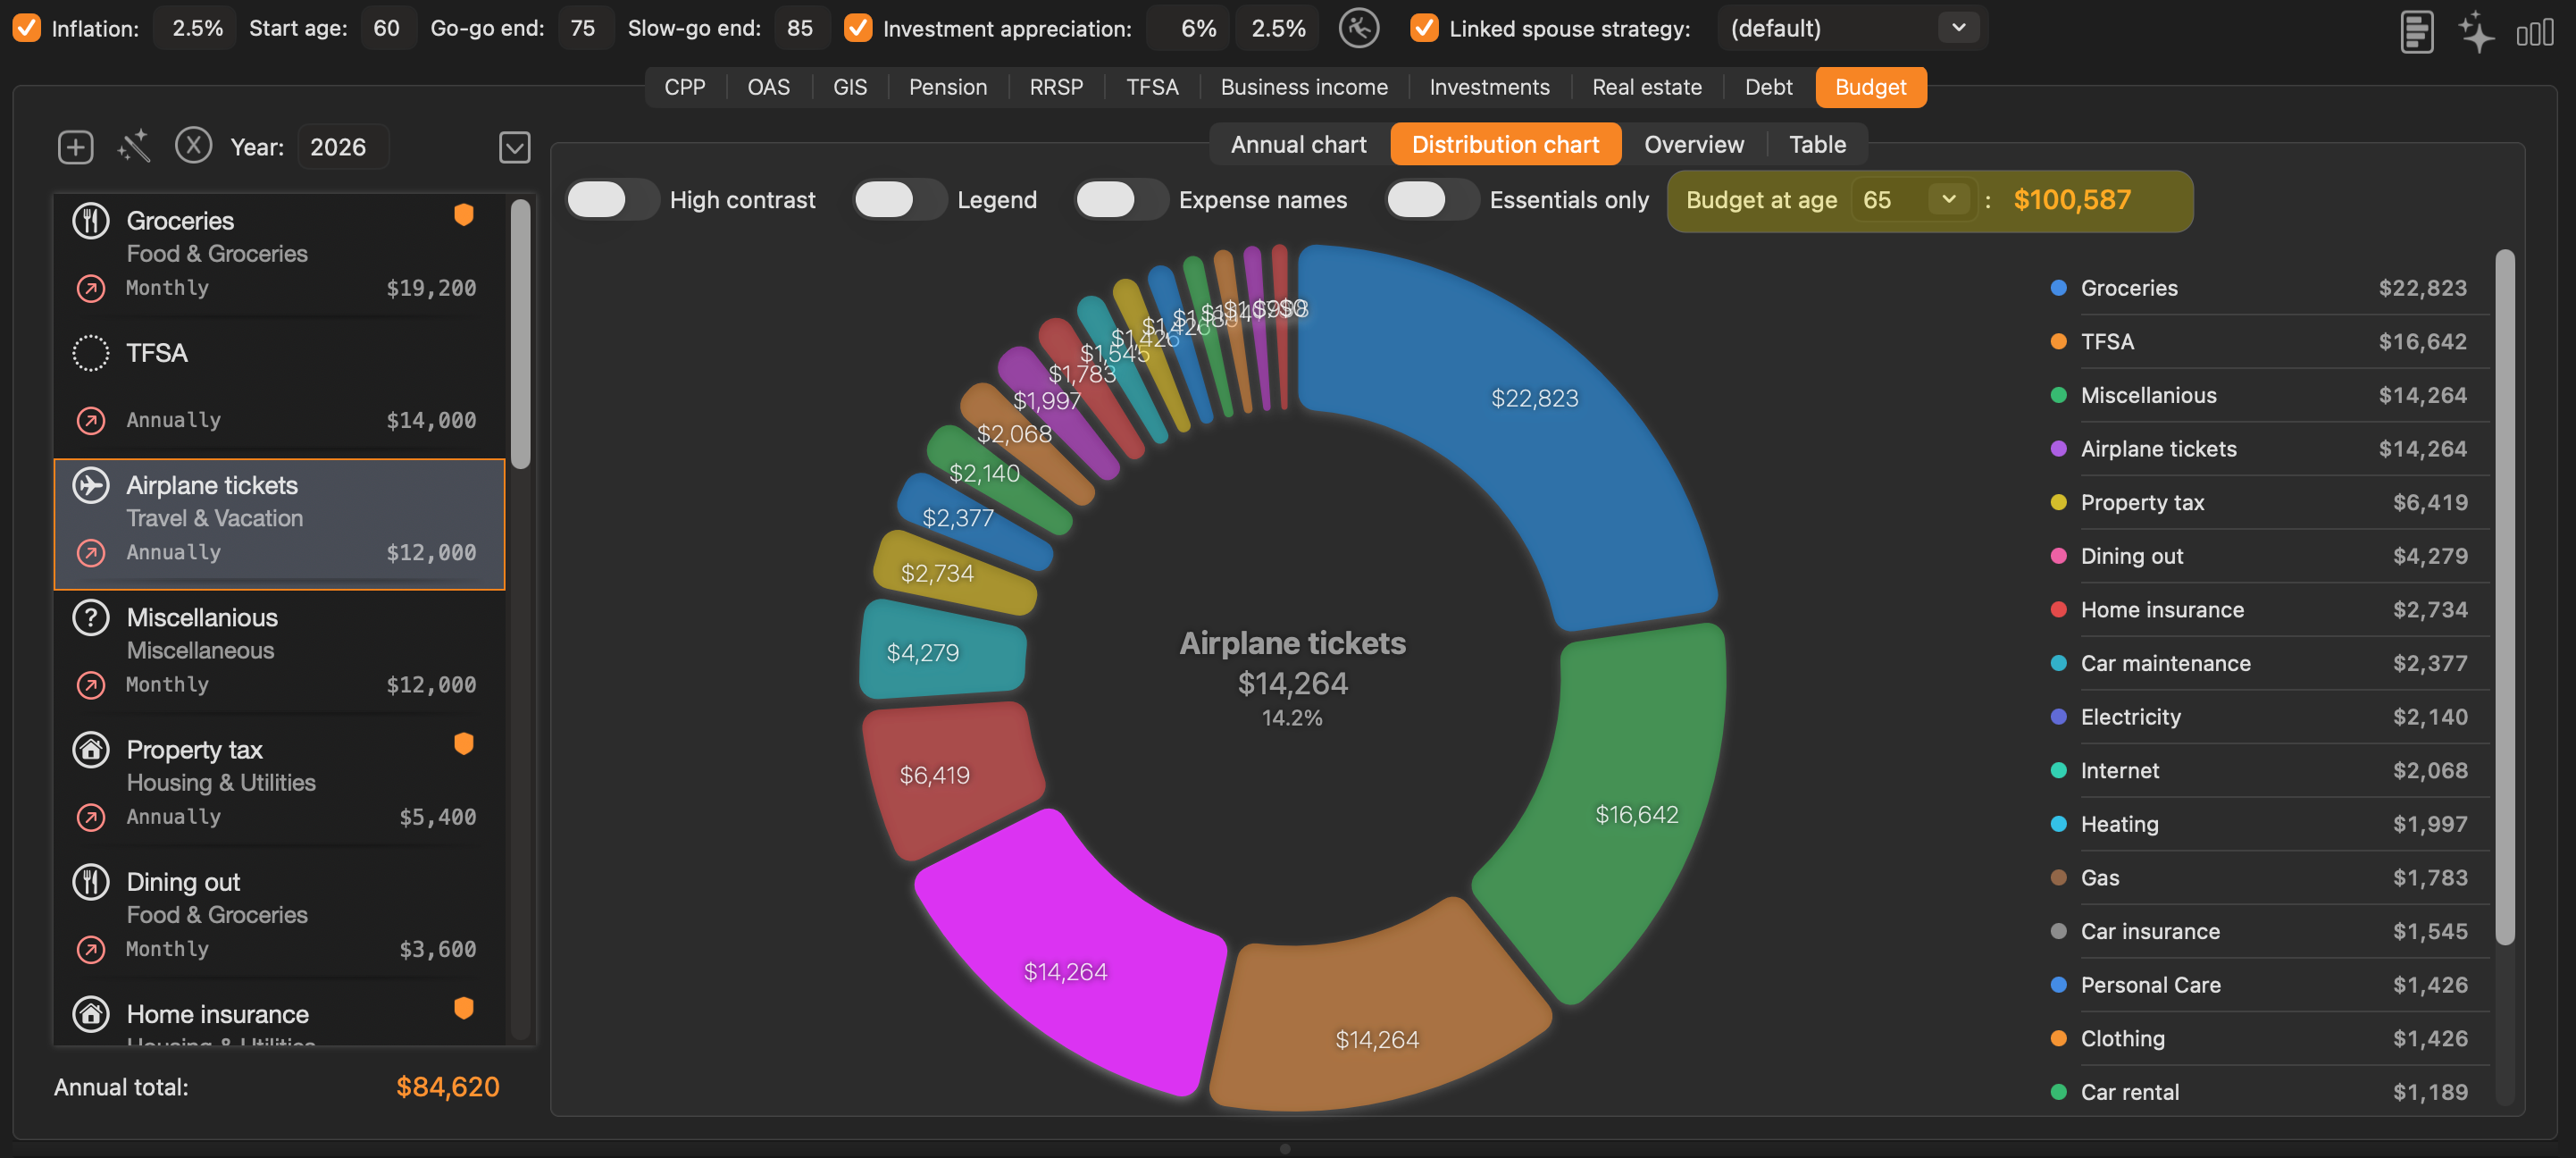
The Distribution chart sub-tab displays a donut chart breaking down how total spending is allocated across categories at a chosen age. Controls along the top of the chart area:
- High contrast — switches the chart palette to high-contrast colours, improving legibility for printed reports or accessibility needs.
- Legend — shows or hides the category legend alongside the chart.
- Expense names — shows or hides individual expense item labels on each segment.
- Essentials only — filters the chart to show only items flagged as Essential, hiding all discretionary items.
The Budget at age dropdown (highlighted) lets you select any age within the strategy range. The donut chart and the total budget amount update immediately to reflect the projected spending distribution at that age (incorporating inflation adjustments and any items whose age ranges include that age).
Overview
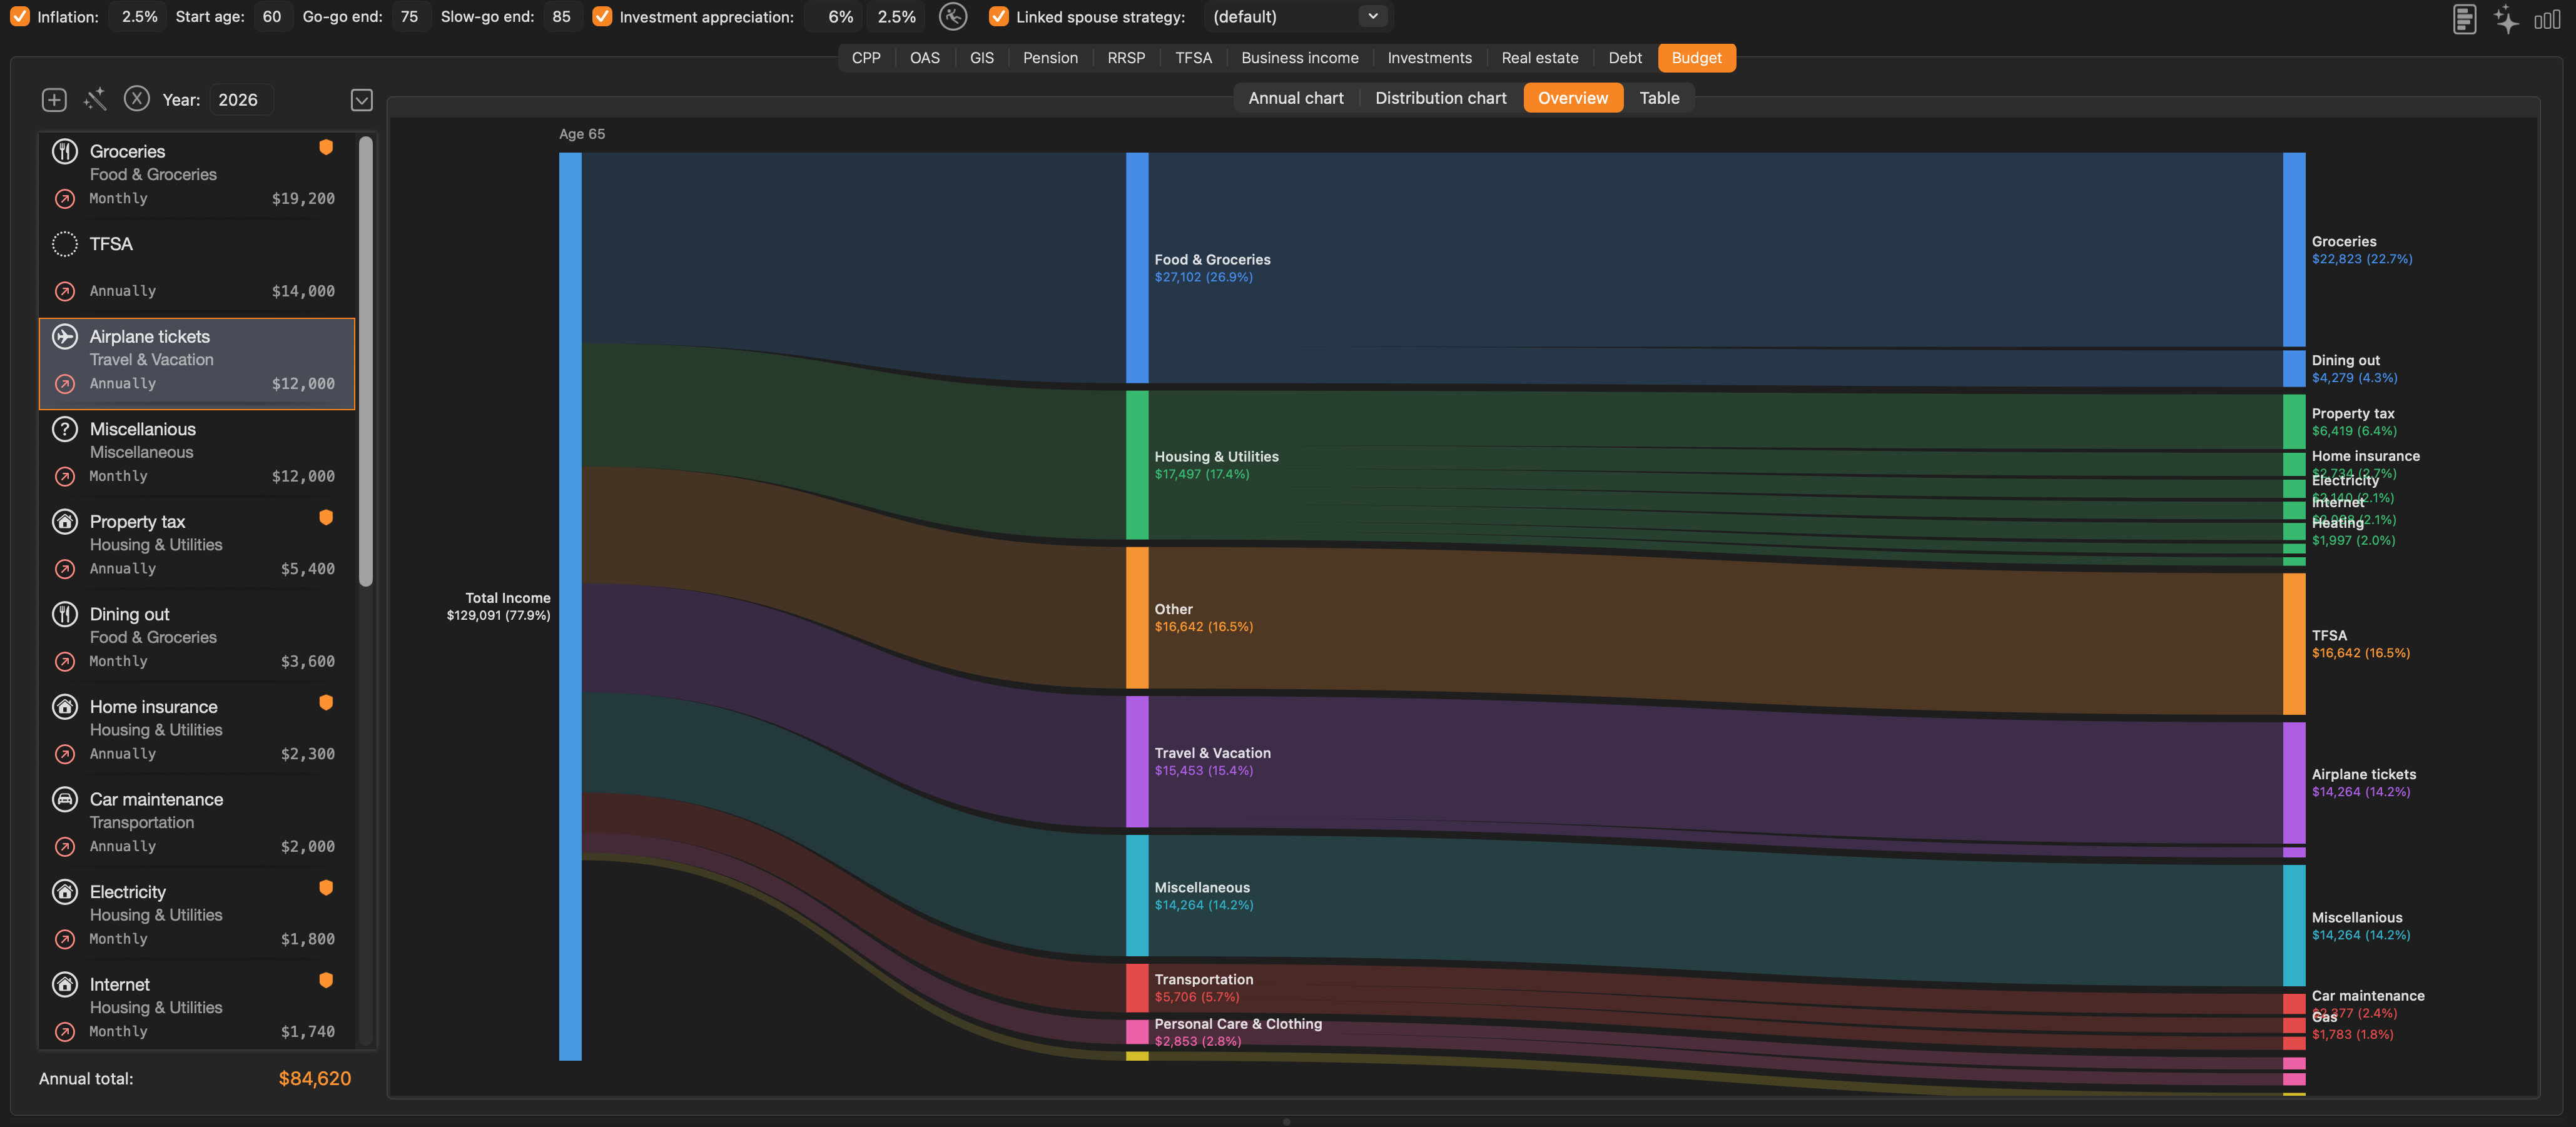
The Overview sub-tab presents a Sankey flow diagram that maps total projected income through the hierarchy of spending categories down to individual budget items. Reading left to right:
- Left column — Total Income: a single bar representing total projected income for the selected year.
- Middle column — Categories: each spending category (Food & Groceries, Housing & Utilities, Travel & Vacation, Transportation, Personal Care & Clothing, Fitness & Recreation, Miscellaneous, Other) is shown as a proportional block. The width of the flow band connecting Total Income to each category reflects that category’s share of total spending.
- Right column — Individual items: each budget item within a category is shown with its projected annual amount and its percentage of total income.
This view makes it easy to see at a glance which categories dominate the budget and which individual items drive the largest share of spending relative to total income.
Table
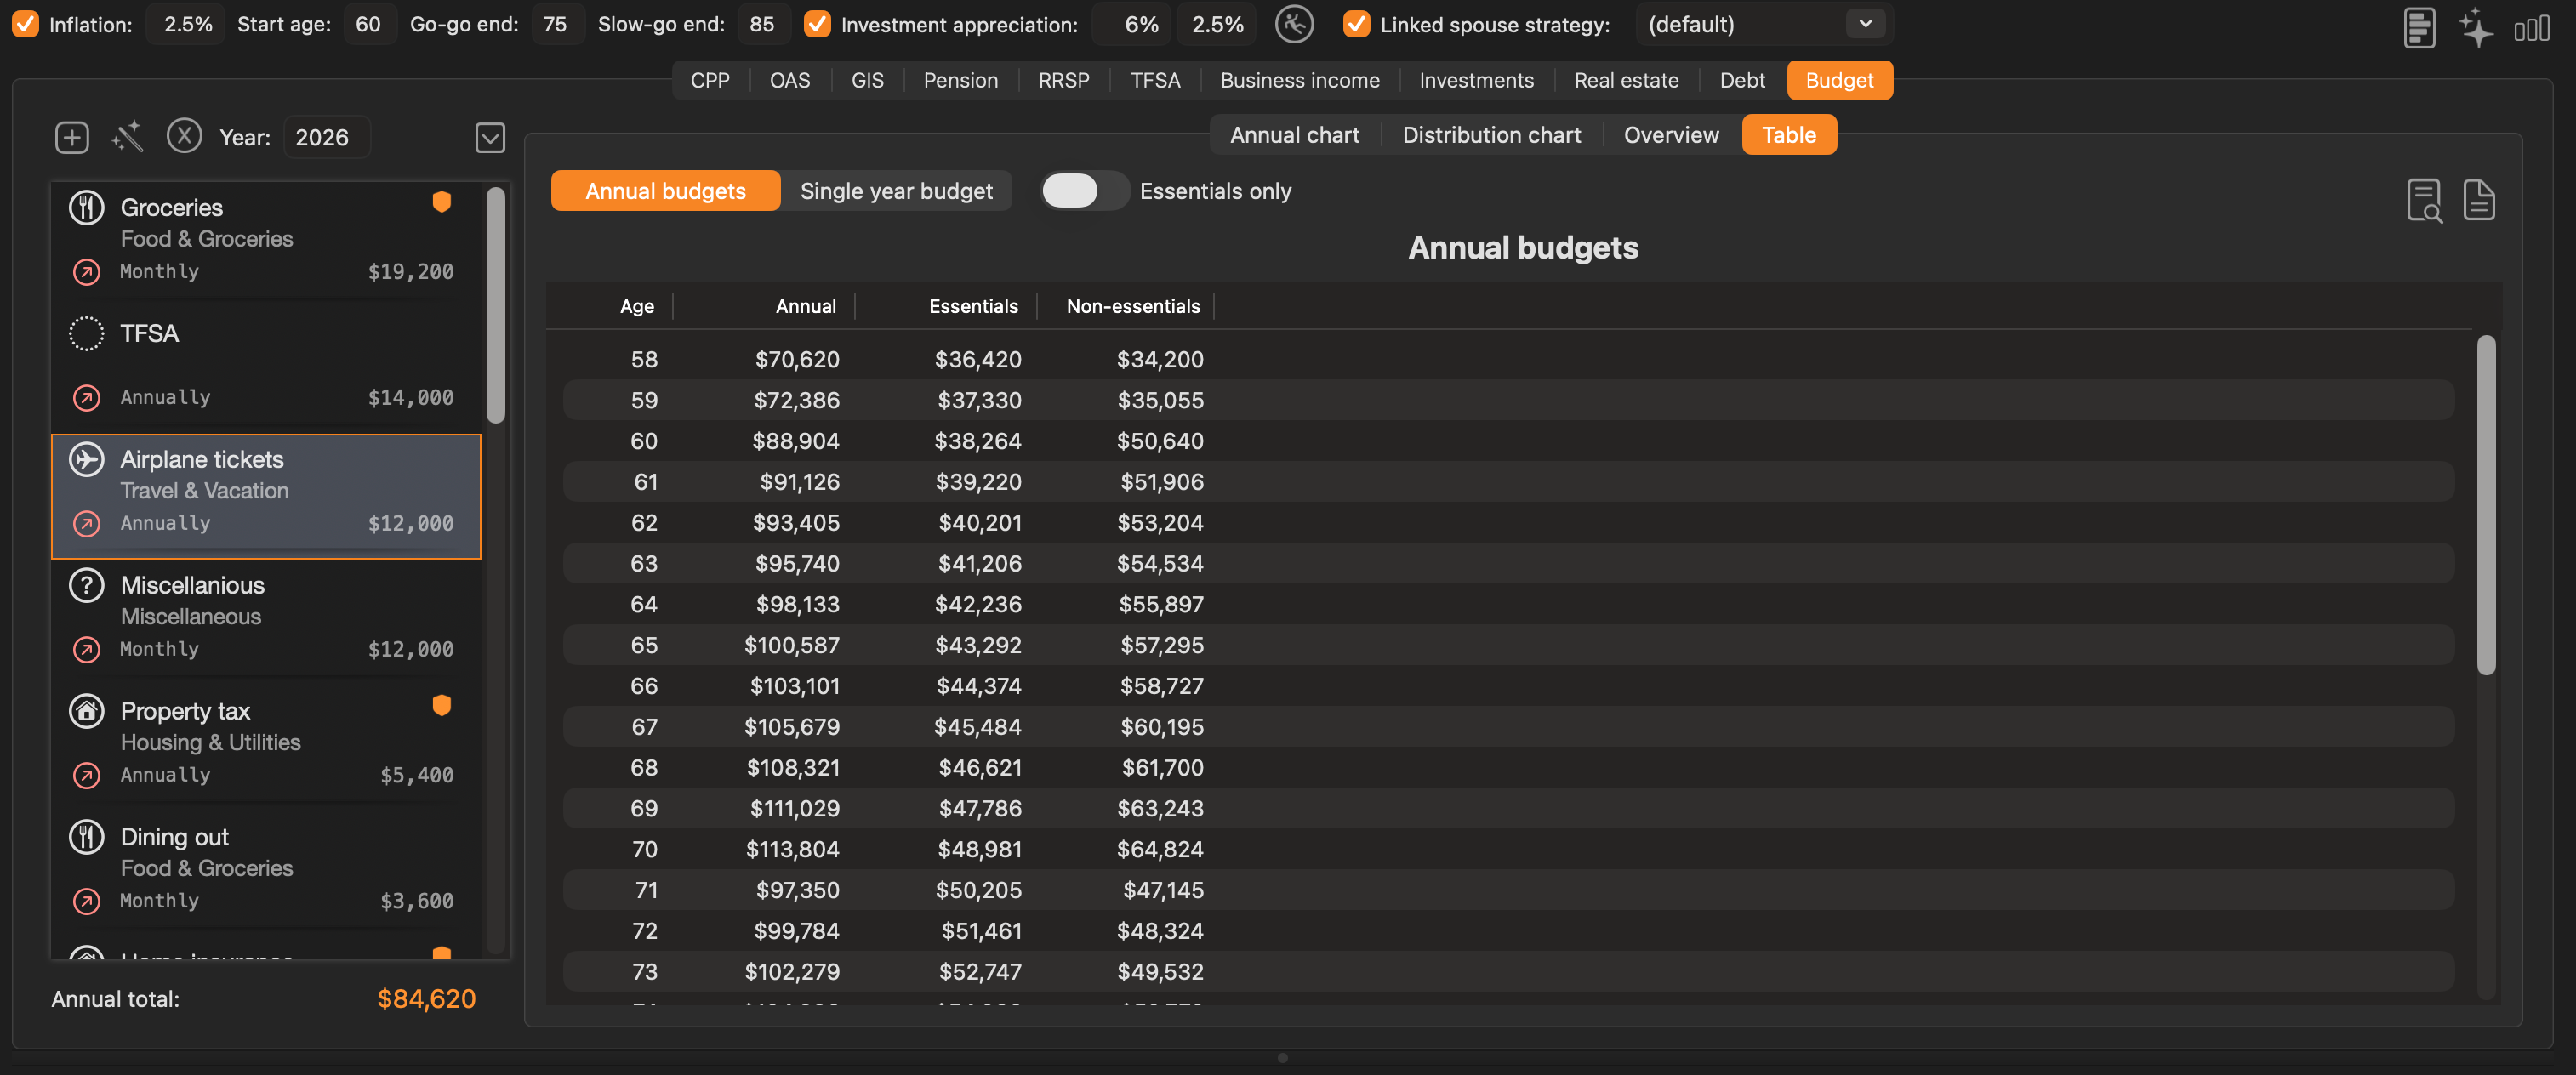
The Table sub-tab displays a year-by-year numeric breakdown of budgeted expenses. Columns:
| Column | Description |
|---|---|
| Age | The client’s age in that projection year |
| Annual | Total projected annual budget (all items, inflated to that year) |
| Essentials | Sub-total of items flagged as Essential |
| Non-essentials | Sub-total of items not flagged as Essential |
Controls above the table:
- Annual budgets / Single year budget — toggles between two display modes. Annual budgets shows the full year-by-year schedule inflated across the entire projection range. Single year budget shows the budget as entered (in today’s dollars), useful for reviewing the raw input values without inflation applied.
- Essentials only — when enabled, filters the table rows to show only the Essential sub-totals, hiding non-essential items. This mirrors the same filter available on the Distribution chart.
How the budget is used
The budget total is used as the spending target when evaluating whether the retirement plan produces sufficient income:
- In the Stress Test (see Section 12), the “Annual income meets budget” success definition compares each year’s projected after-tax income against the budget.
- The budget also drives the AI income optimization feature — the AI adjusts withdrawal schedules to close any gap between projected income and budgeted expenses.
- Every command in Section 11 — Automatic Withdrawal Adjustment requires a budget. Without one, those commands stop with a Budget Required message.
7.15 Copying a Budget Between Strategies#
Building a budget is often the most time-consuming part of setting up a strategy. Rather than re-entering it for every scenario, you can copy a finished budget from one strategy to another.
To copy a budget:
- Select the strategy whose budget you want to copy.
- Right-click the strategy in the strategy list and choose Copy Budget to Strategy….
- In the sheet that appears, pick the destination strategy from the dropdown. Strategies are listed as Client name — Strategy name, so you can copy across clients as well as within one.
- Click Copy.
The copied budget is an independent duplicate — editing it afterwards in either strategy leaves the other untouched. The destination’s per-age budget is rebuilt immediately, so budget-dependent commands become available there right away.
Warning: Copying replaces the destination strategy’s existing budget entirely. There is no undo. If the destination already has a budget worth keeping, duplicate that strategy first.
Note: The command is unavailable if the current strategy has no budget entries, or if no other strategy exists to copy to.
 Blue Plum Software