6. Entering Income Sources#
The client edit form contains a dedicated tab for each of the eleven income sources supported by Retirement Planner. You only need to fill in the tabs that apply — any tab left at zero or default values simply contributes nothing to the projection.
For a quick overview of all tabs, refer to the summary table in Section 2.4.
6.1 Canada Pension Plan (CPP)#
The CPP tab lets you enter the client’s Canada Pension Plan contribution history so the app can estimate their projected CPP benefit at retirement. Two input methods are available, selected via the segment control at the top of the tab.
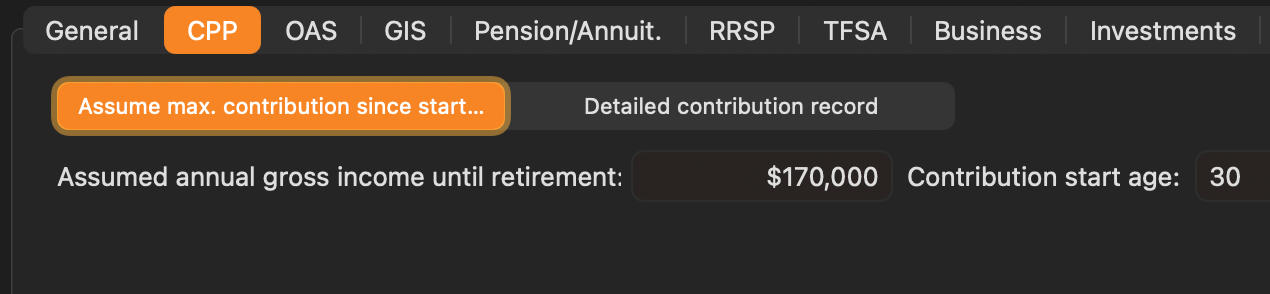
Method 1 — Assume Maximum Contribution Since Start
Select “Assume max. contribution since start…” for a quick, simplified estimate. The app assumes the client contributed the maximum CPP amount every year from the contribution start age until retirement.
- Assumed annual gross income until retirement — the client’s average gross employment income. The app uses this to estimate contribution amounts each year relative to the CPP contribution ceiling.
- Contribution start age — the age at which the client began making CPP contributions (typically the age they entered the workforce, often around 18–26).
This method is well-suited when the exact contribution history is not available or when a conservative upper-bound estimate is sufficient.
Method 2 — Detailed Contribution Record
Select “Detailed contribution record” to enter the client’s actual year-by-year CPP contribution history. This produces a more precise benefit estimate.
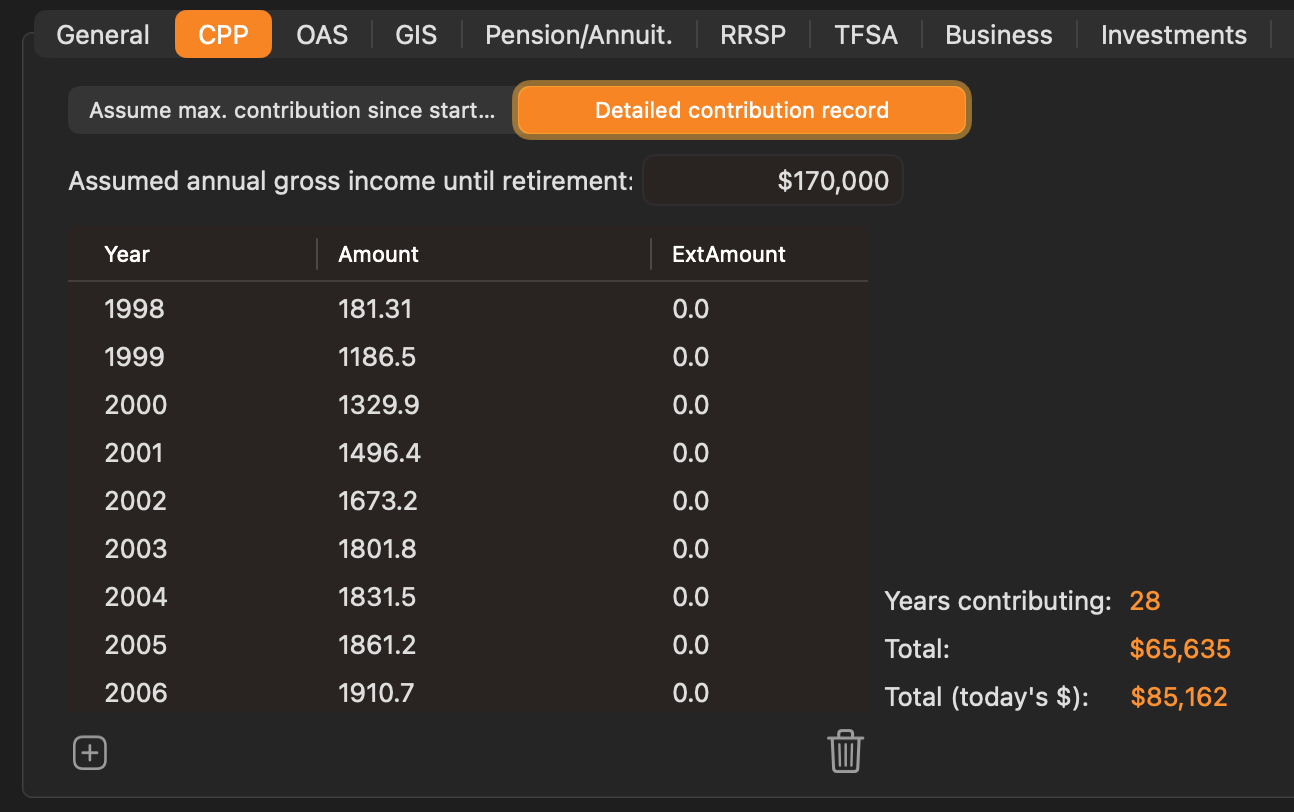
Click the + button to add a row. Each row represents one calendar year of contributions:
| Column | Description |
|---|---|
| Year | The calendar year of the contribution |
| Amount | The base CPP contribution for that year |
| ExtAmount | The CPP2 (enhanced second component) contribution for that year, if applicable |
Select a row and click the trash button to remove it.
The summary at the bottom of the tab updates as you enter data:
- Years contributing — total number of years with a recorded contribution
- Total — the nominal sum of all contributions entered
- Total (today’s $) — the inflation-adjusted present value of all contributions
Tip — Getting your CPP Statement of Contributions from CRA
The most accurate source for year-by-year CPP contribution data is your My Service Canada Account (MSCA). To access it:
- Go to canada.ca and search for My Service Canada Account, or navigate directly to canada.ca/my-service-canada-account.
- Sign in using one of the accepted methods: GCKey, a Sign-In Partner (your bank’s online login), or a provincial digital identity where available.
- Once signed in, select Canada Pension Plan from the main menu.
- Choose Statement of Contributions. This page lists every year you had pensionable earnings, the amount of earnings subject to CPP, and the contributions made for that year.
- Enter each year’s contribution amounts into the table in the Detailed contribution record mode.
If you have not yet registered for My Service Canada Account, you can do so on the same page using a GCKey or your bank credentials. Registration takes a few minutes and requires your Social Insurance Number (SIN).
6.2 Old Age Security (OAS)#
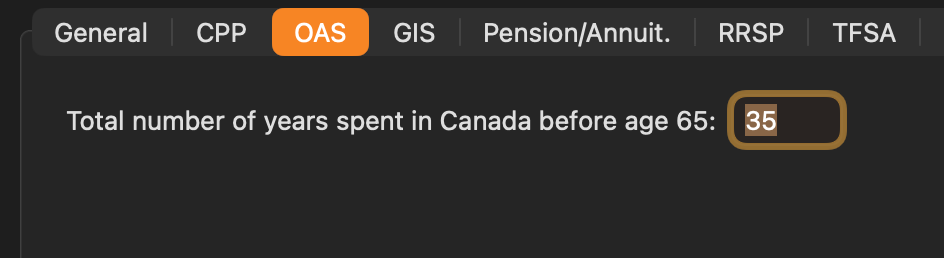
The OAS tab has a single input field. The app calculates the projected OAS benefit automatically based on the client’s Canadian residency history.
Total number of years spent in Canada before age 65 Enter the total number of years the client lived in Canada between age 18 and age 65. This determines what fraction of the full OAS pension the client is entitled to receive.
A full OAS pension requires 40 years of Canadian residency after age 18. Clients who lived in Canada for fewer than 40 years receive a partial OAS pension, prorated at 1/40th of the full amount per year of residency. For example, a client with 39 years of residency (as shown above) receives 39/40 (97.5%) of the full OAS benefit.
Example: A client who immigrated to Canada at age 30 and retires at age 65 has 35 years of residency — they would receive 35/40 (87.5%) of the full OAS pension.
The app applies OAS starting at age 65 by default and incorporates the OAS Recovery Tax (clawback) automatically in the tax calculation if the client’s projected net income exceeds the annual threshold. No separate configuration is needed for either of these.
6.3 Guaranteed Income Supplement (GIS)#
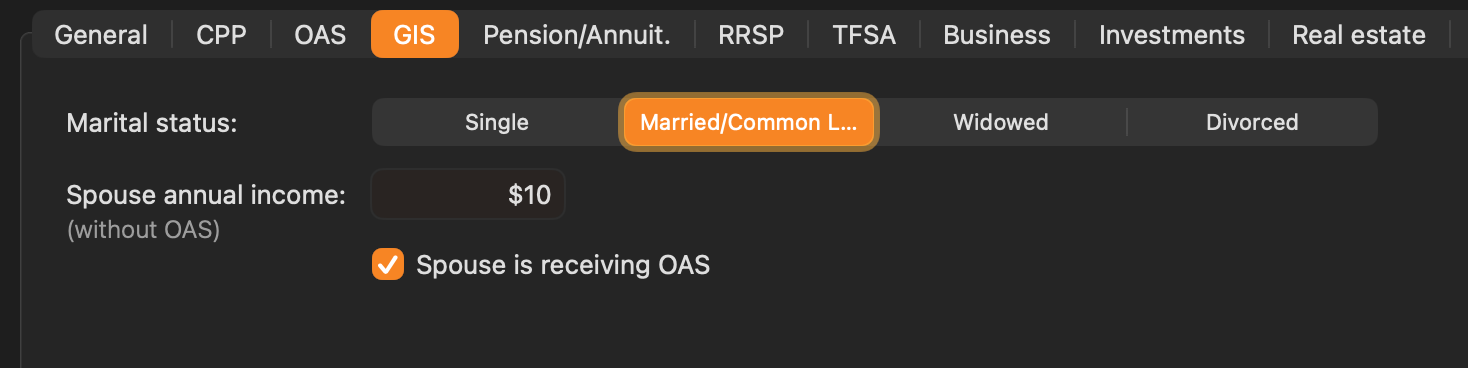
GIS is a non-taxable monthly benefit added on top of OAS for low-income retirees. It is fully income-tested — as other income rises, GIS is reduced and eventually eliminated. The GIS amount depends not only on the client’s own income but also on their marital status and, for couples, the spouse’s income. The GIS tab collects the information the app needs to calculate this correctly.
Marital Status Select the client’s marital status using the segment control: Single, Married / Common-law, Widowed, or Divorced. This determines which GIS rate table the app uses:
- Single, Widowed, or Divorced — the higher single-person GIS rates apply.
- Married / Common-law — the lower couples’ GIS rates apply, and the spouse’s income is factored into the income test.
Spouse Annual Income (without OAS) Visible when Married / Common-law is selected. Enter the spouse’s projected annual income excluding OAS. The Canadian GIS income test for couples is based on the combined income of both partners, not counting OAS payments received by either spouse. The app uses this value alongside the client’s own projected income to determine the GIS entitlement each year.
Spouse is receiving OAS A checkbox that indicates whether the spouse is also an OAS recipient. This affects which GIS rate schedule applies — Service Canada uses different benefit tables depending on whether both partners receive OAS or only one does.
Note: GIS is calculated entirely by the app — you do not enter a GIS dollar amount directly. All fields here provide the household context the app needs to apply the correct GIS rules. GIS is particularly sensitive to RRSP/RRIF withdrawals: large mandatory RRIF payments can push net income above the GIS cut-off threshold and eliminate the benefit entirely.
6.4 Pension / Annuity#
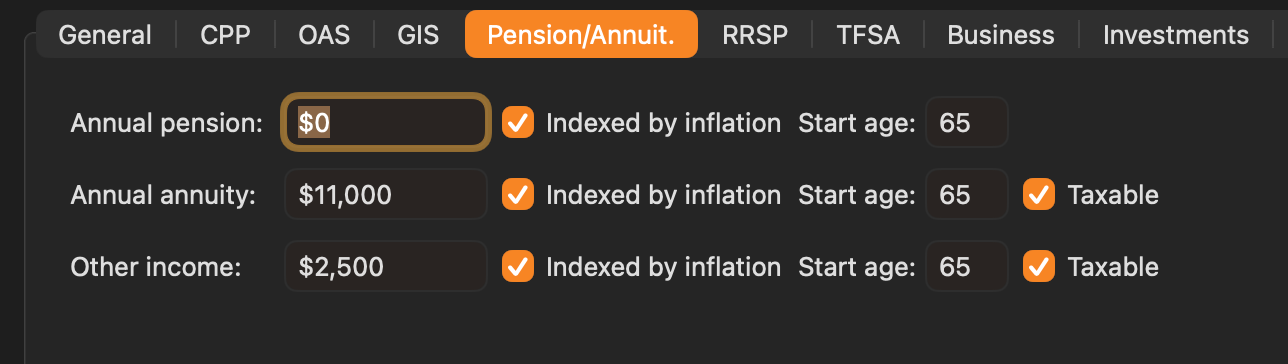
This tab covers three types of fixed recurring income. Each is configured independently with its own amount, start age, and options.
Annual Pension The gross annual amount from a defined-benefit (DB) employer pension. Set Start age to the age at which pension payments begin. Check Indexed by inflation if the pension includes cost-of-living adjustments that track the inflation rate set in the strategy.
Pension income from a registered DB plan is always taxable in Canada and is treated as such by the app.
Annual Annuity The gross annual payout from a purchased annuity. Set Start age to the age payments begin. The Taxable checkbox controls whether this income is included in taxable income — some annuity structures include a return-of-capital portion that may be partially or fully non-taxable; consult a tax advisor if unsure.
Other Income Any recurring income not covered by the other tabs — for example, a foreign pension, regular trust distributions, or spousal support. Set Start age to the age this income begins, and check Taxable if it is subject to Canadian income tax.
Indexed by inflation When checked for any row, the entered amount grows each year at the inflation rate set in the strategy. This preserves the income’s real purchasing power across the projection. When unchecked, the nominal amount stays fixed throughout the projection period.
6.5 RRSP#
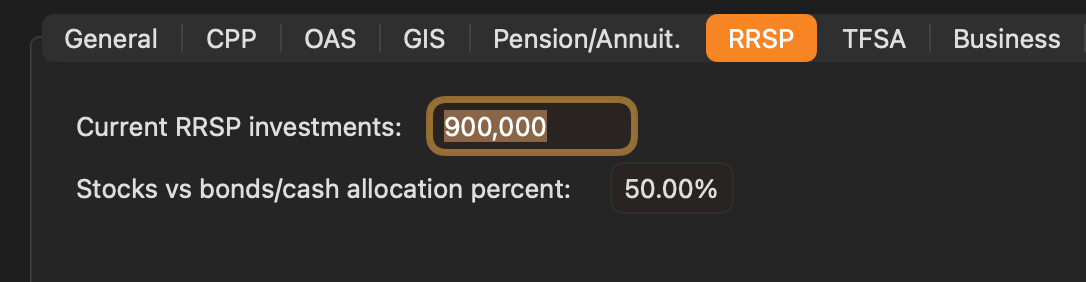
The RRSP tab captures the current state of the client’s Registered Retirement Savings Plan.
Current RRSP investments The total current market value of the client’s RRSP holdings. The app grows this balance each year using the return rates set in the strategy, applies mandatory RRIF minimum withdrawals once the account has been converted to a RRIF, and includes the resulting income in the annual tax calculation.
Stocks vs bonds/cash allocation percent The percentage of the RRSP invested in equities (stocks). The remainder is treated as bonds/cash. The app applies the strategy’s equity return rate to the stock portion and the bond return rate to the remainder. For example, 60% means 60% of the balance grows at the equity rate and 40% at the bond rate.
RRIF conversion: The app converts the RRSP to a RRIF and calculates the CRA-prescribed minimum withdrawal each year from that point on. These withdrawals are fully taxable as income. Conversion defaults to age 71 — the latest age the CRA permits — but you can model an earlier conversion per strategy; see Section 7.8 — RRSP.
6.6 TFSA#
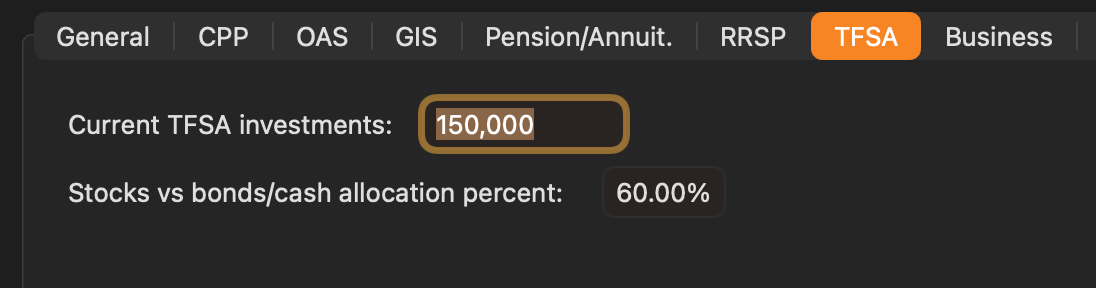
The TFSA tab captures the current state of the client’s Tax-Free Savings Account.
Current TFSA investments The total current market value of the client’s TFSA holdings. The balance grows each year tax-free at the blended rate determined by the allocation setting below. Withdrawals from a TFSA are not included in taxable income and do not affect means-tested benefits such as GIS or the OAS clawback.
Stocks vs bonds/cash allocation percent The percentage of the TFSA invested in equities. Works identically to the RRSP allocation field — the equity rate applies to the stock portion and the bond rate applies to the remainder.
6.7 Business#
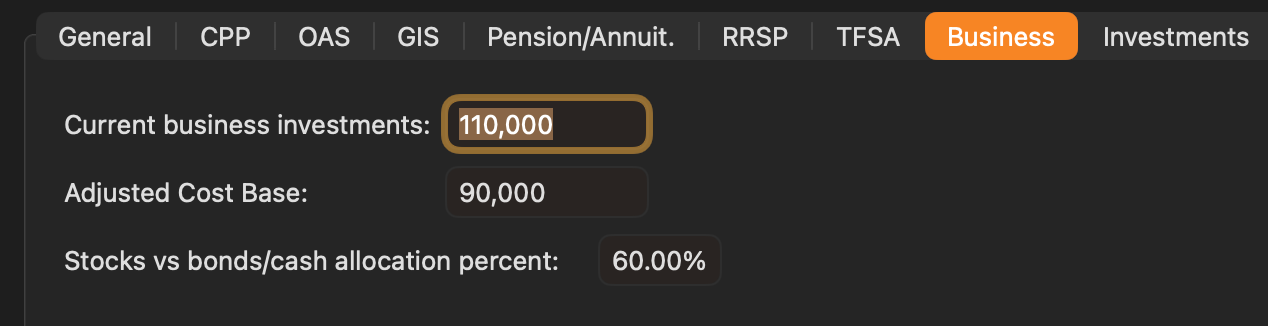
The Business tab captures investments held inside a corporation or business structure.
Current business investments The current market value of investments held within the business. The app grows this balance using the same return rates as other investment accounts, blended according to the allocation setting below.
Adjusted Cost Base The original cost of the business investments for tax purposes. The difference between the current market value and the ACB represents the accrued capital gain. When the business investments are eventually liquidated in the projection, the app uses this figure to estimate the capital gains tax owing.
Stocks vs bonds/cash allocation percent The percentage of the business portfolio invested in equities, applied identically to the RRSP and TFSA allocation fields.
6.8 Investments#
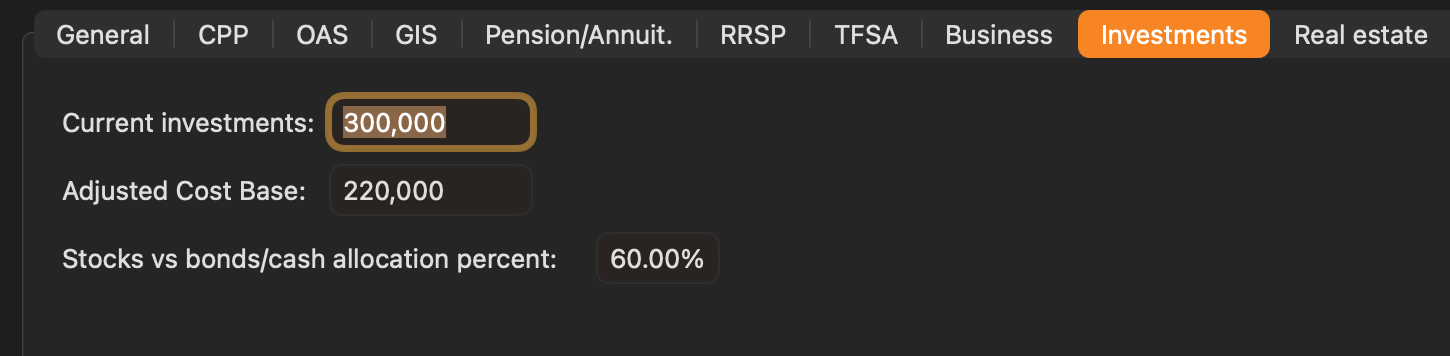
The Investments tab captures the client’s non-registered (taxable) investment portfolio — stocks, ETFs, mutual funds, or other market holdings held outside registered accounts.
Current investments The current market value of the non-registered portfolio.
Adjusted Cost Base The original purchase cost of the portfolio for tax purposes. The difference between the current market value and the ACB is the accrued capital gain. When the app models a full or partial liquidation of the portfolio, it estimates the resulting capital gains tax using this figure and the strategy’s assumed marginal tax rate.
Stocks vs bonds/cash allocation percent The percentage of the portfolio invested in equities. Applied identically to the other investment tabs — the equity return rate applies to the stock portion and the bond rate to the remainder.
Example: With $300,000 in current investments, an ACB of $210,000, and a 60/40 allocation, the portfolio has an accrued gain of $90,000. 60% of the balance grows at the equity rate each year and 40% at the bond rate.
6.9 Real Estate#
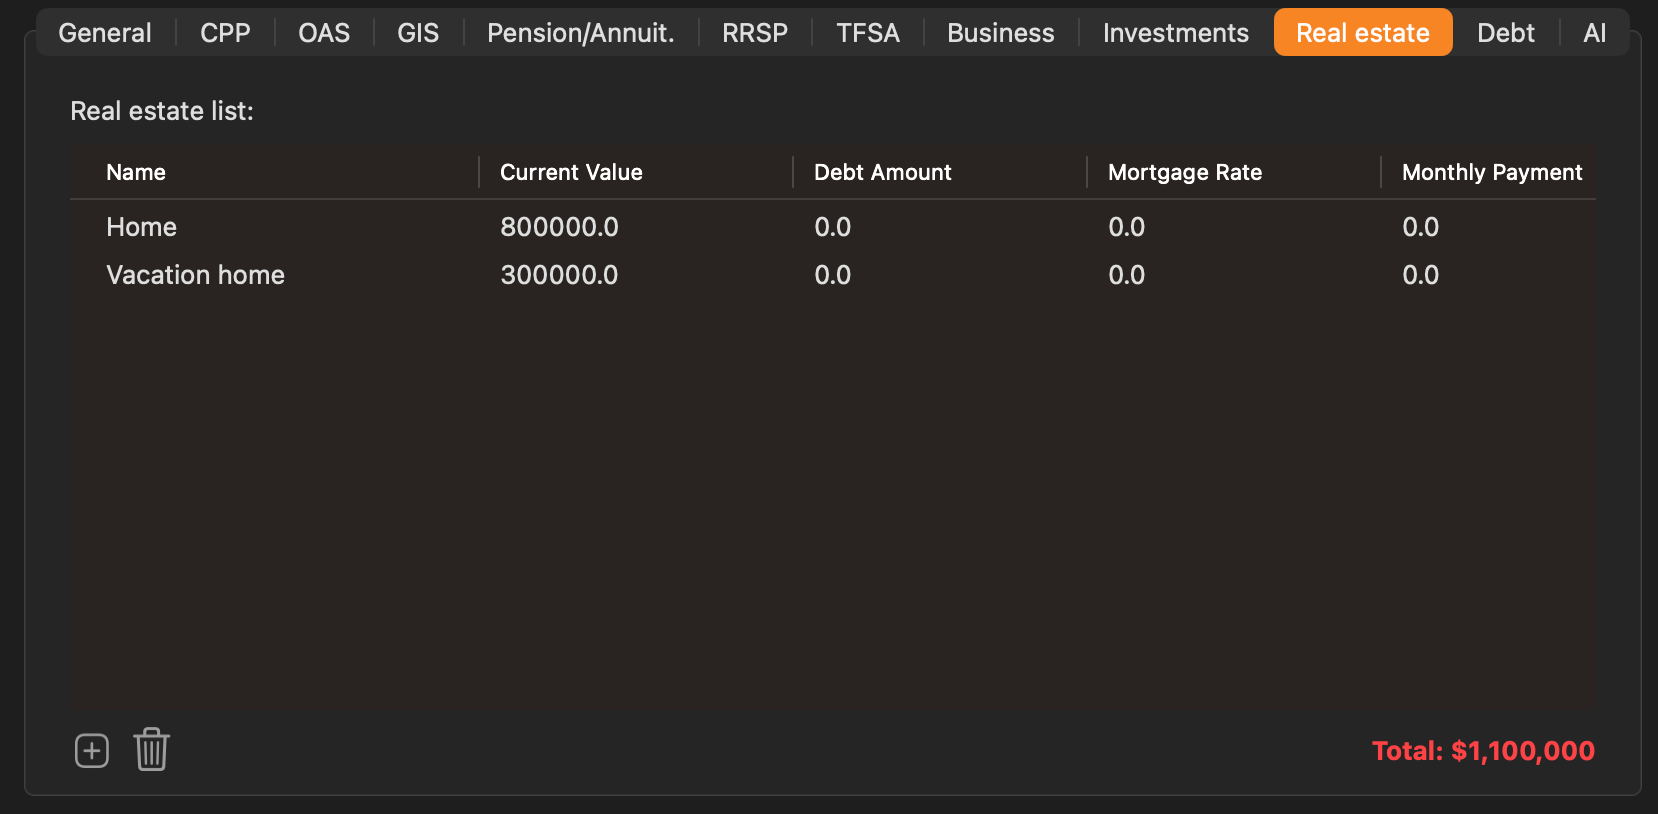
The Real Estate tab manages the client’s property holdings. All properties are listed in a table. Use the + button at the bottom left to add a property and the trash button to remove the selected one.
Each row in the list represents one property with the following columns:
| Column | Description |
|---|---|
| Name | A label for identification, e.g. “Home” or “Cottage” |
| Current Value | The property’s current market value |
| Debt Amount | The outstanding mortgage or loan balance secured against this property |
| Mortgage Rate | The annual interest rate on the mortgage, as a percentage |
| Monthly Payment | The monthly mortgage payment |
The app uses the debt amount, mortgage rate, and monthly payment to project when the mortgage will be paid off and to calculate the property’s net equity each year. Net equity (current value minus remaining debt) contributes to the client’s projected net worth.
The Total displayed in orange at the bottom right is the sum of the current market values of all properties in the list.
Note: Additional property details — such as annual appreciation rate, disposal age, and whether to exclude a property from the net worth chart — may be accessible by selecting a row.
6.10 Debt#
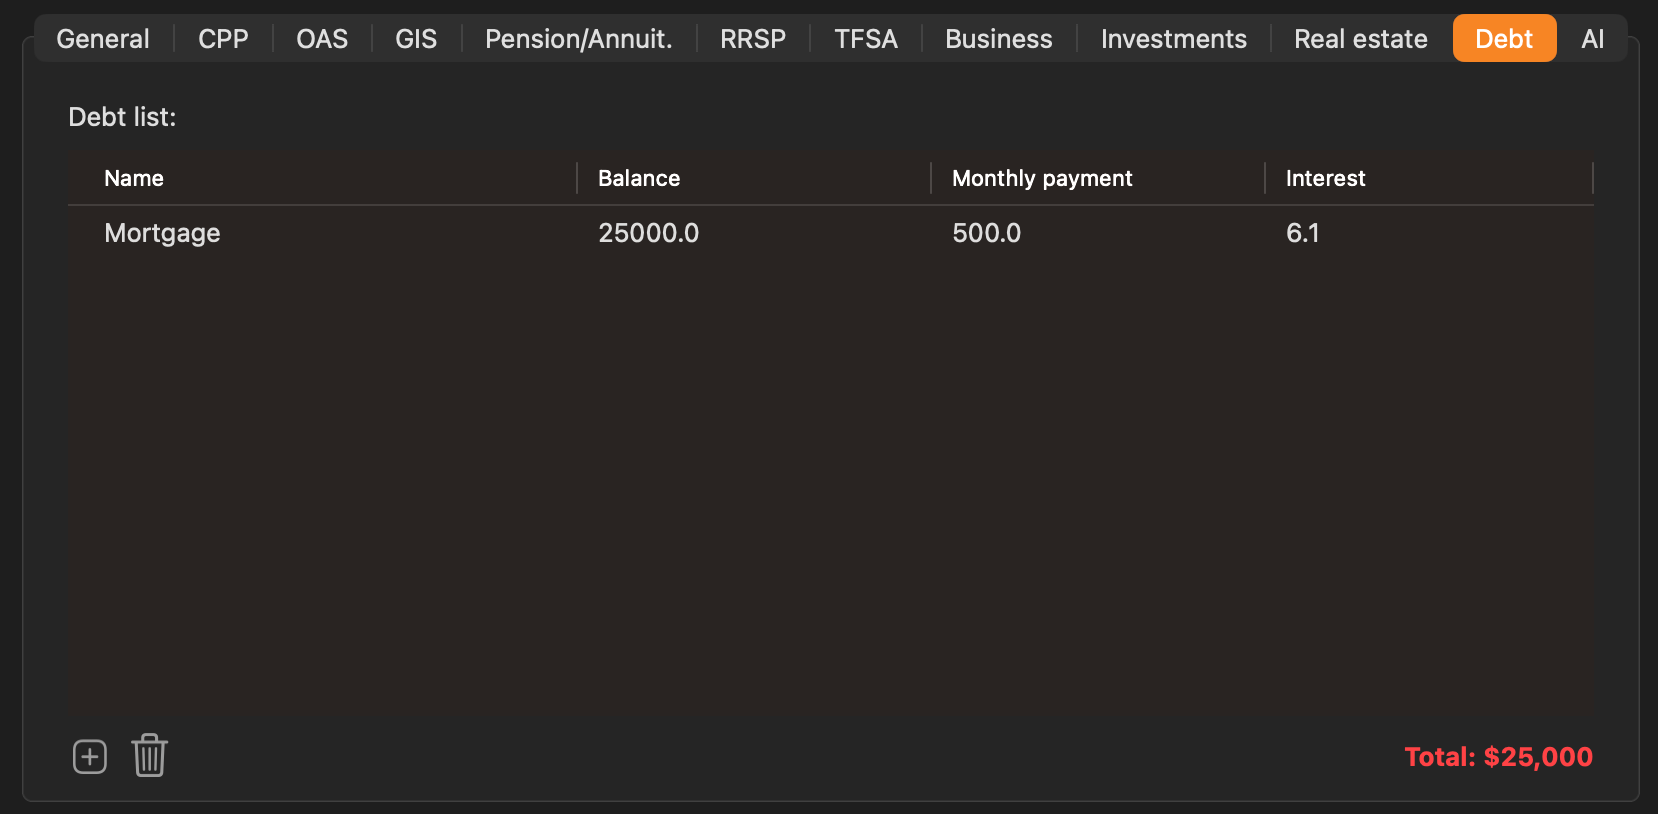
The Debt tab tracks the client’s outstanding liabilities beyond real estate mortgages — lines of credit, car loans, personal loans, and similar obligations. Use the + button to add a debt and the trash button to remove the selected one.
Each row represents one debt with the following columns:
| Column | Description |
|---|---|
| Name | A label for identification, e.g. “LOC” or “Car loan” |
| Balance | The current outstanding balance |
| Monthly payment | The monthly payment being made against this debt |
| Interest | The annual interest rate, as a percentage |
The app uses these values to project how each debt is paid down over time and deducts the remaining balances from the client’s net worth each year.
The Total displayed in red at the bottom right is the sum of all outstanding debt balances. The red colour signals that this amount reduces the client’s net worth.
Tip: Mortgages entered here in the Debt tab are separate from mortgages entered in the Real Estate tab. To avoid double-counting liabilities, enter a mortgage either in Real Estate (linked to a specific property) or in Debt — not both. In the example above, the Home mortgage appears in both tabs because it was entered for illustration; in practice, link it to the property in the Real Estate tab.
6.11 AI#
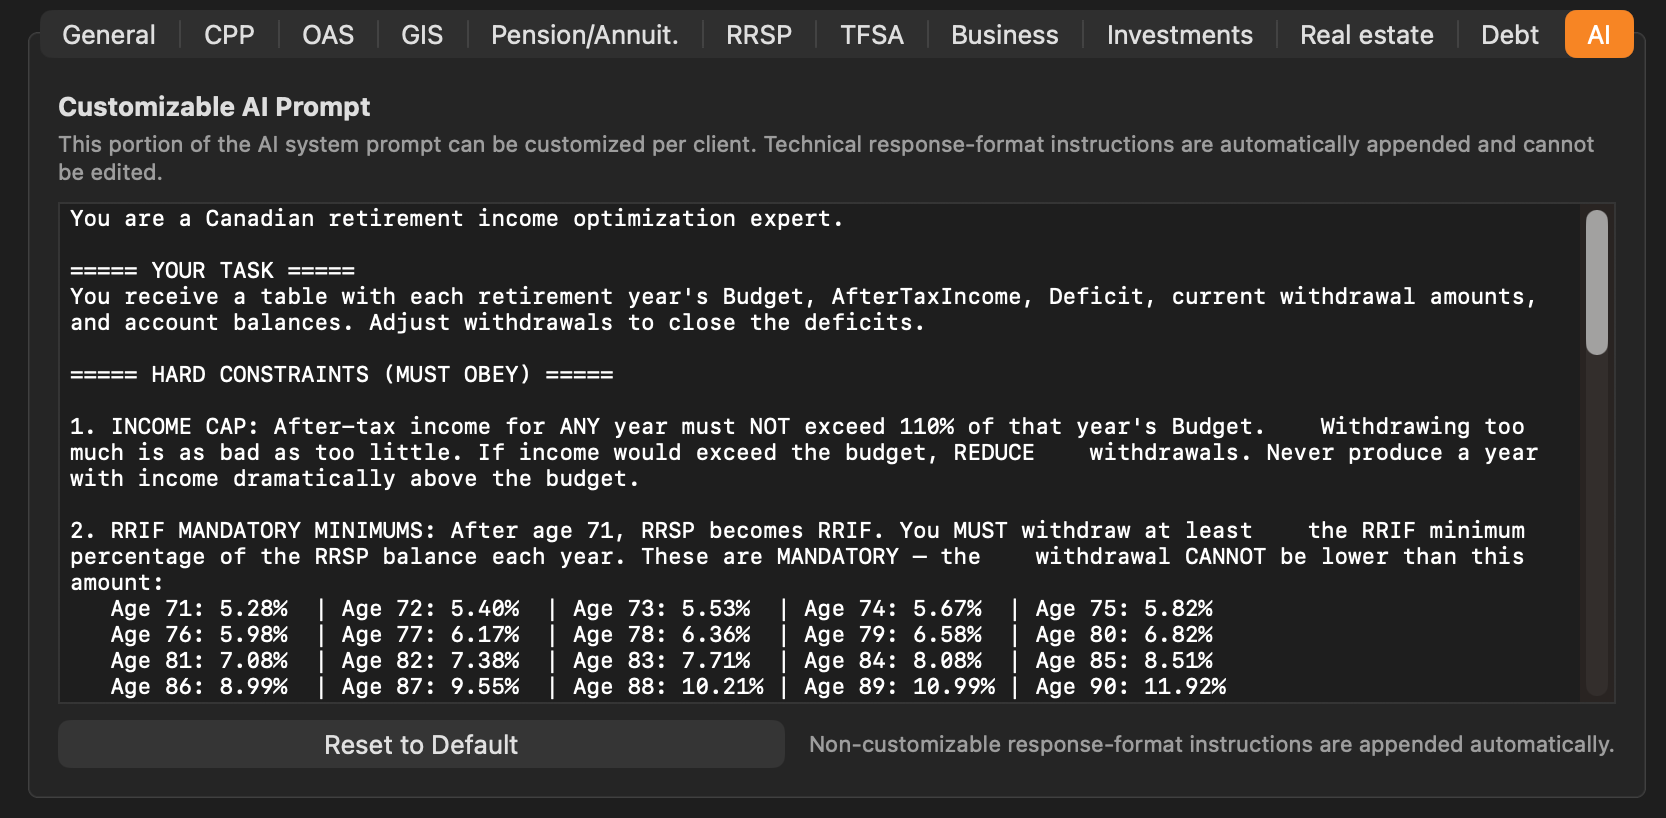
The AI tab lets you customize the system prompt that is sent to the AI engine when AI-assisted analysis is used for this client. This is an advanced feature intended for users who want to tailor the AI’s behaviour, tone, or constraints for a specific client’s situation.
Customizable AI Prompt The large text area contains the portion of the AI system prompt that you can freely edit. The default prompt instructs the AI to act as a Canadian retirement income optimization expert and defines the task (adjusting withdrawals to close income deficits) along with hard constraints the AI must respect — such as the income cap rule and mandatory RRIF minimum withdrawal percentages by age.
Changes made here apply only to this client and persist across sessions.
What you can customize
- The AI’s role description and areas of focus
- The specific task or objective you want the AI to address
- Additional constraints or preferences relevant to this client (e.g., avoid drawing from TFSA before age 75, prioritize minimizing OAS clawback)
- Tone or communication style if the AI output is client-facing
What cannot be edited Technical response-format instructions are automatically appended to your prompt by the app and are not shown in the text area. These ensure that the AI returns data in a structured format the app can parse. The note at the bottom of the tab — “Non-customizable response-format instructions are appended automatically” — confirms this.
Reset to Default Click this button to discard any changes and restore the original built-in prompt for this client.
Note: AI features require a Pro or Advisor subscription. If the AI tab is visible but the feature is inactive, check your subscription status.
 Blue Plum Software