2. Getting Started#
2.1 System Requirements#
Operating System Retirement Planner requires macOS 14 Sonoma or later. For the best experience, macOS 15 Sequoia or later is recommended.
Hardware Any Mac capable of running macOS 14 or later is supported. This includes:
- MacBook Air and MacBook Pro (2018 or later)
- Mac mini (2018 or later)
- iMac (2019 or later)
- Mac Pro (2019 or later)
- Mac Studio (all models)
- Any Apple Silicon Mac (M1 or later)
No special graphics hardware or minimum RAM requirement applies. The Monte Carlo stress test runs intensive calculations and will complete faster on Apple Silicon and modern Intel Macs.
Display Retirement Planner is a chart-intensive application. While it runs on any supported Mac display, a higher-resolution screen — such as a Retina or Liquid Retina display — is strongly recommended. Charts, income bands, and net worth projections are significantly easier to read at higher pixel densities. An external 4K or 5K monitor is an excellent option for advisors reviewing detailed projections with clients.
Disk Space Less than 50 MB for the application itself. Client data files are small (typically under 1 MB per client portfolio).
Internet Connection An internet connection is not required to use the application. However, a periodic connection (at most once per week) allows the app to silently download updated Canadian tax parameters — bracket amounts, OAS/CPP/GIS thresholds — so that projections always reflect the most current published rates without requiring a full app update.
2.2 Installation#
Retirement Planner is distributed through the Mac App Store.
- Open the App Store app on your Mac and search for Retirement Planner, or follow the direct product link.
- Click Get, then Install. You may be asked to confirm with your Apple ID, Touch ID, or password.
- When installation finishes, launch the app from Launchpad or your Applications folder.
First launch. The app opens with an empty client list and starts the guided tour described in Section 2.5. No account or sign-in is required to use the app.
Permissions. Retirement Planner does not request access to your contacts, calendar, camera, microphone, or location. macOS may ask for permission the first time you choose a folder outside the app’s default storage location — this happens only if you use the Advisor-only Data File Location setting described in Section 5.1, or when you save a PDF report to a folder you select.
Subscription. All plans include a 7-day free trial. See Section 3 — Subscription Plans.
2.3 Navigating the Application#
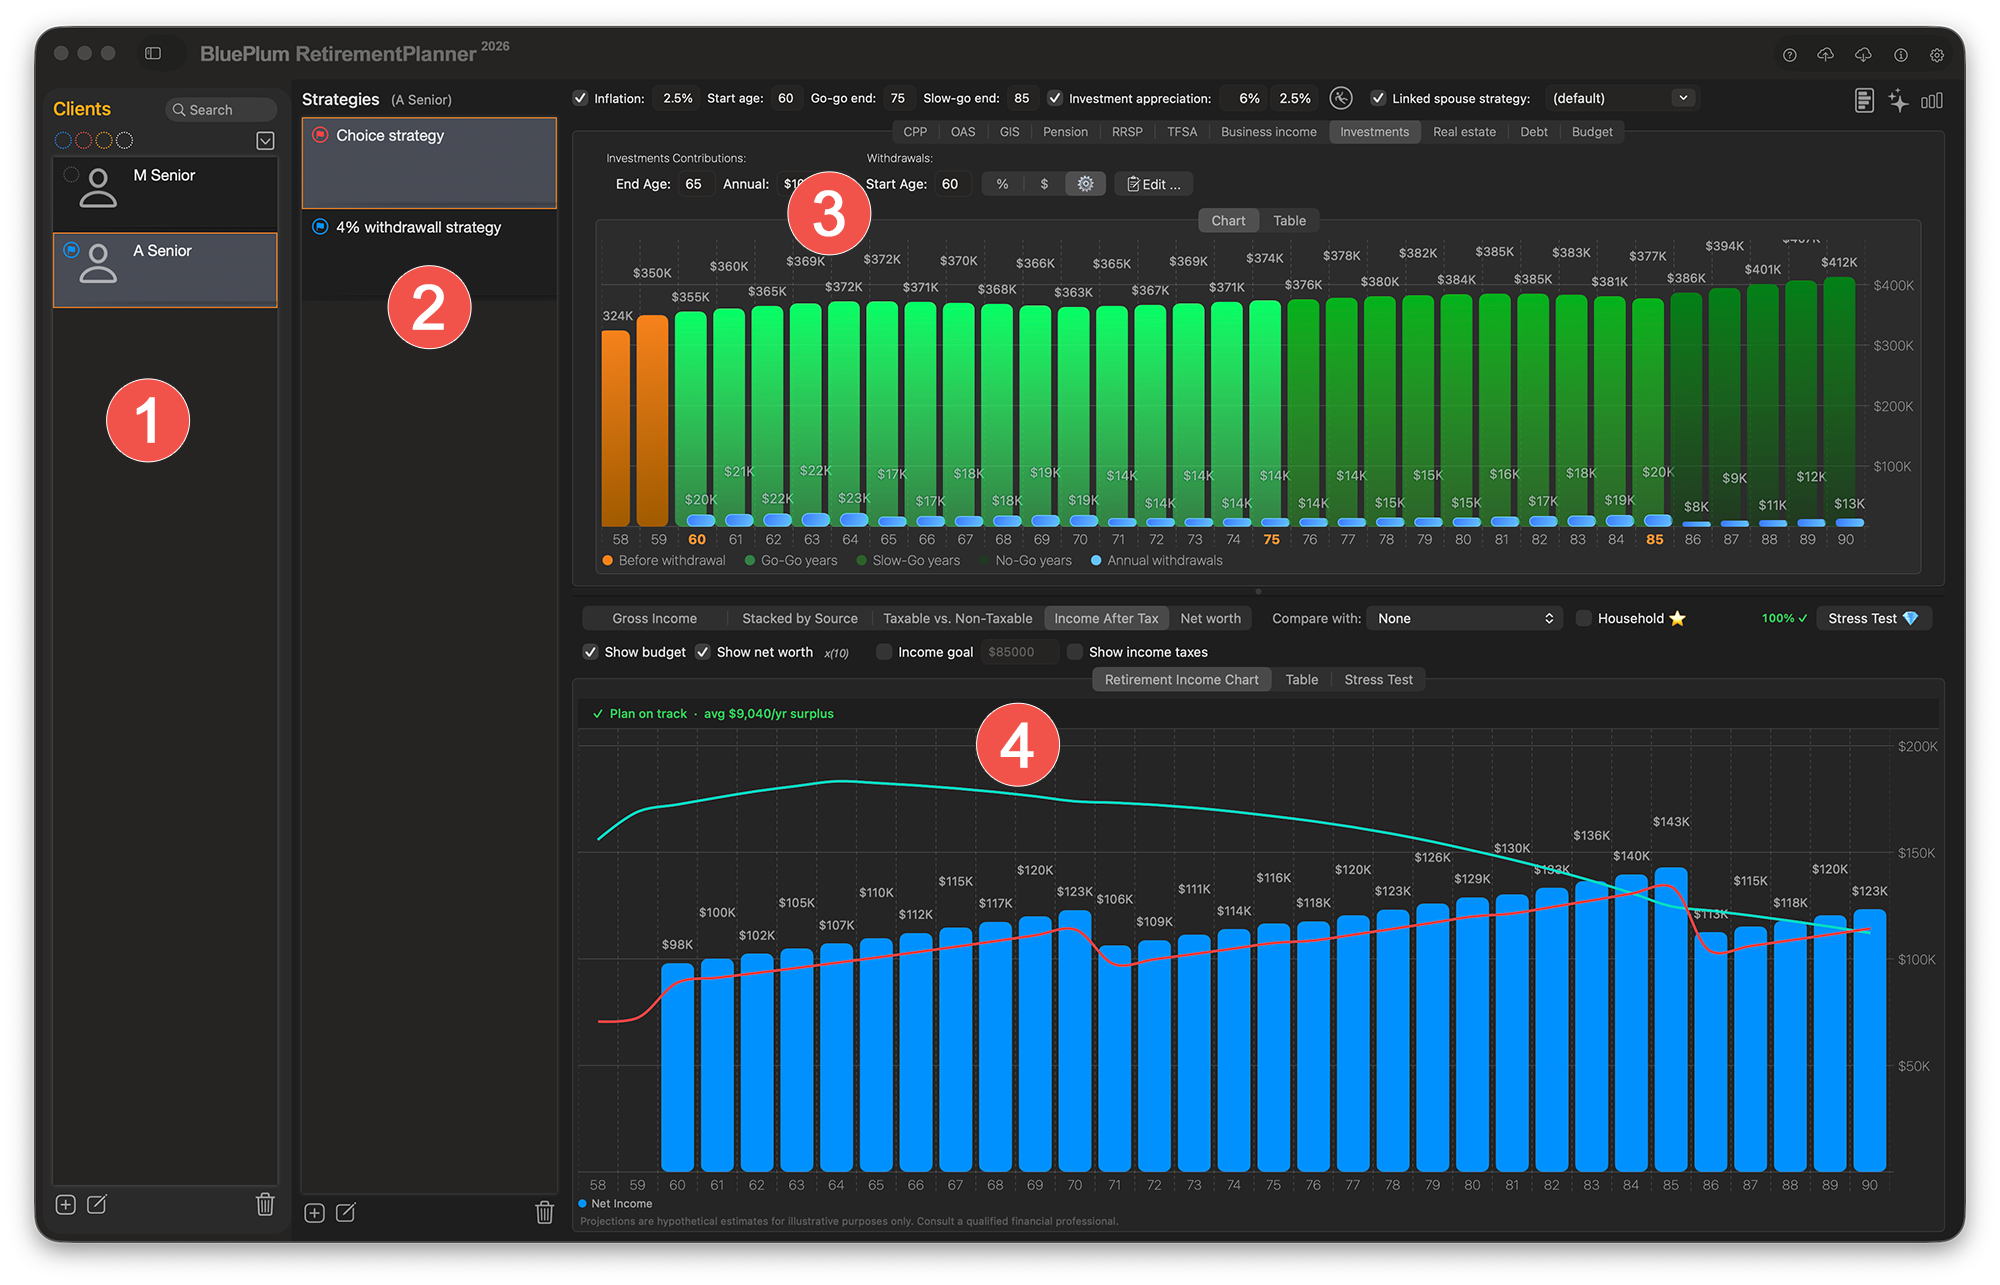
When you first open Retirement Planner, the window is divided into two main areas:
Sidebar (left panel) (1) The sidebar lists all your clients. Each client appears as a row showing their name and a summary of their retirement profile. Clicking a client selects them and loads their strategy in the main content area. Clients can be added, duplicated, or removed using the controls at the bottom of the sidebar.
Main Content Area (right panel) This is where you view and edit a client’s retirement strategy. It is organized into several sections:
- Strategy Selector (2) — at the top of the content area, a dropdown or tab lets you switch between multiple strategies for the same client. Each strategy represents a different retirement scenario.
- Income Source Editors (3) — a set of panels on the left side of the content area let you enter data for each income source (CPP, OAS, RRSP, real estate, etc.). Changes update the chart instantly.
- Income Chart (4) — the large chart on the right shows the projected retirement income and/or net worth over time. The x-axis represents age, and the y-axis represents annual income or net worth in dollars.
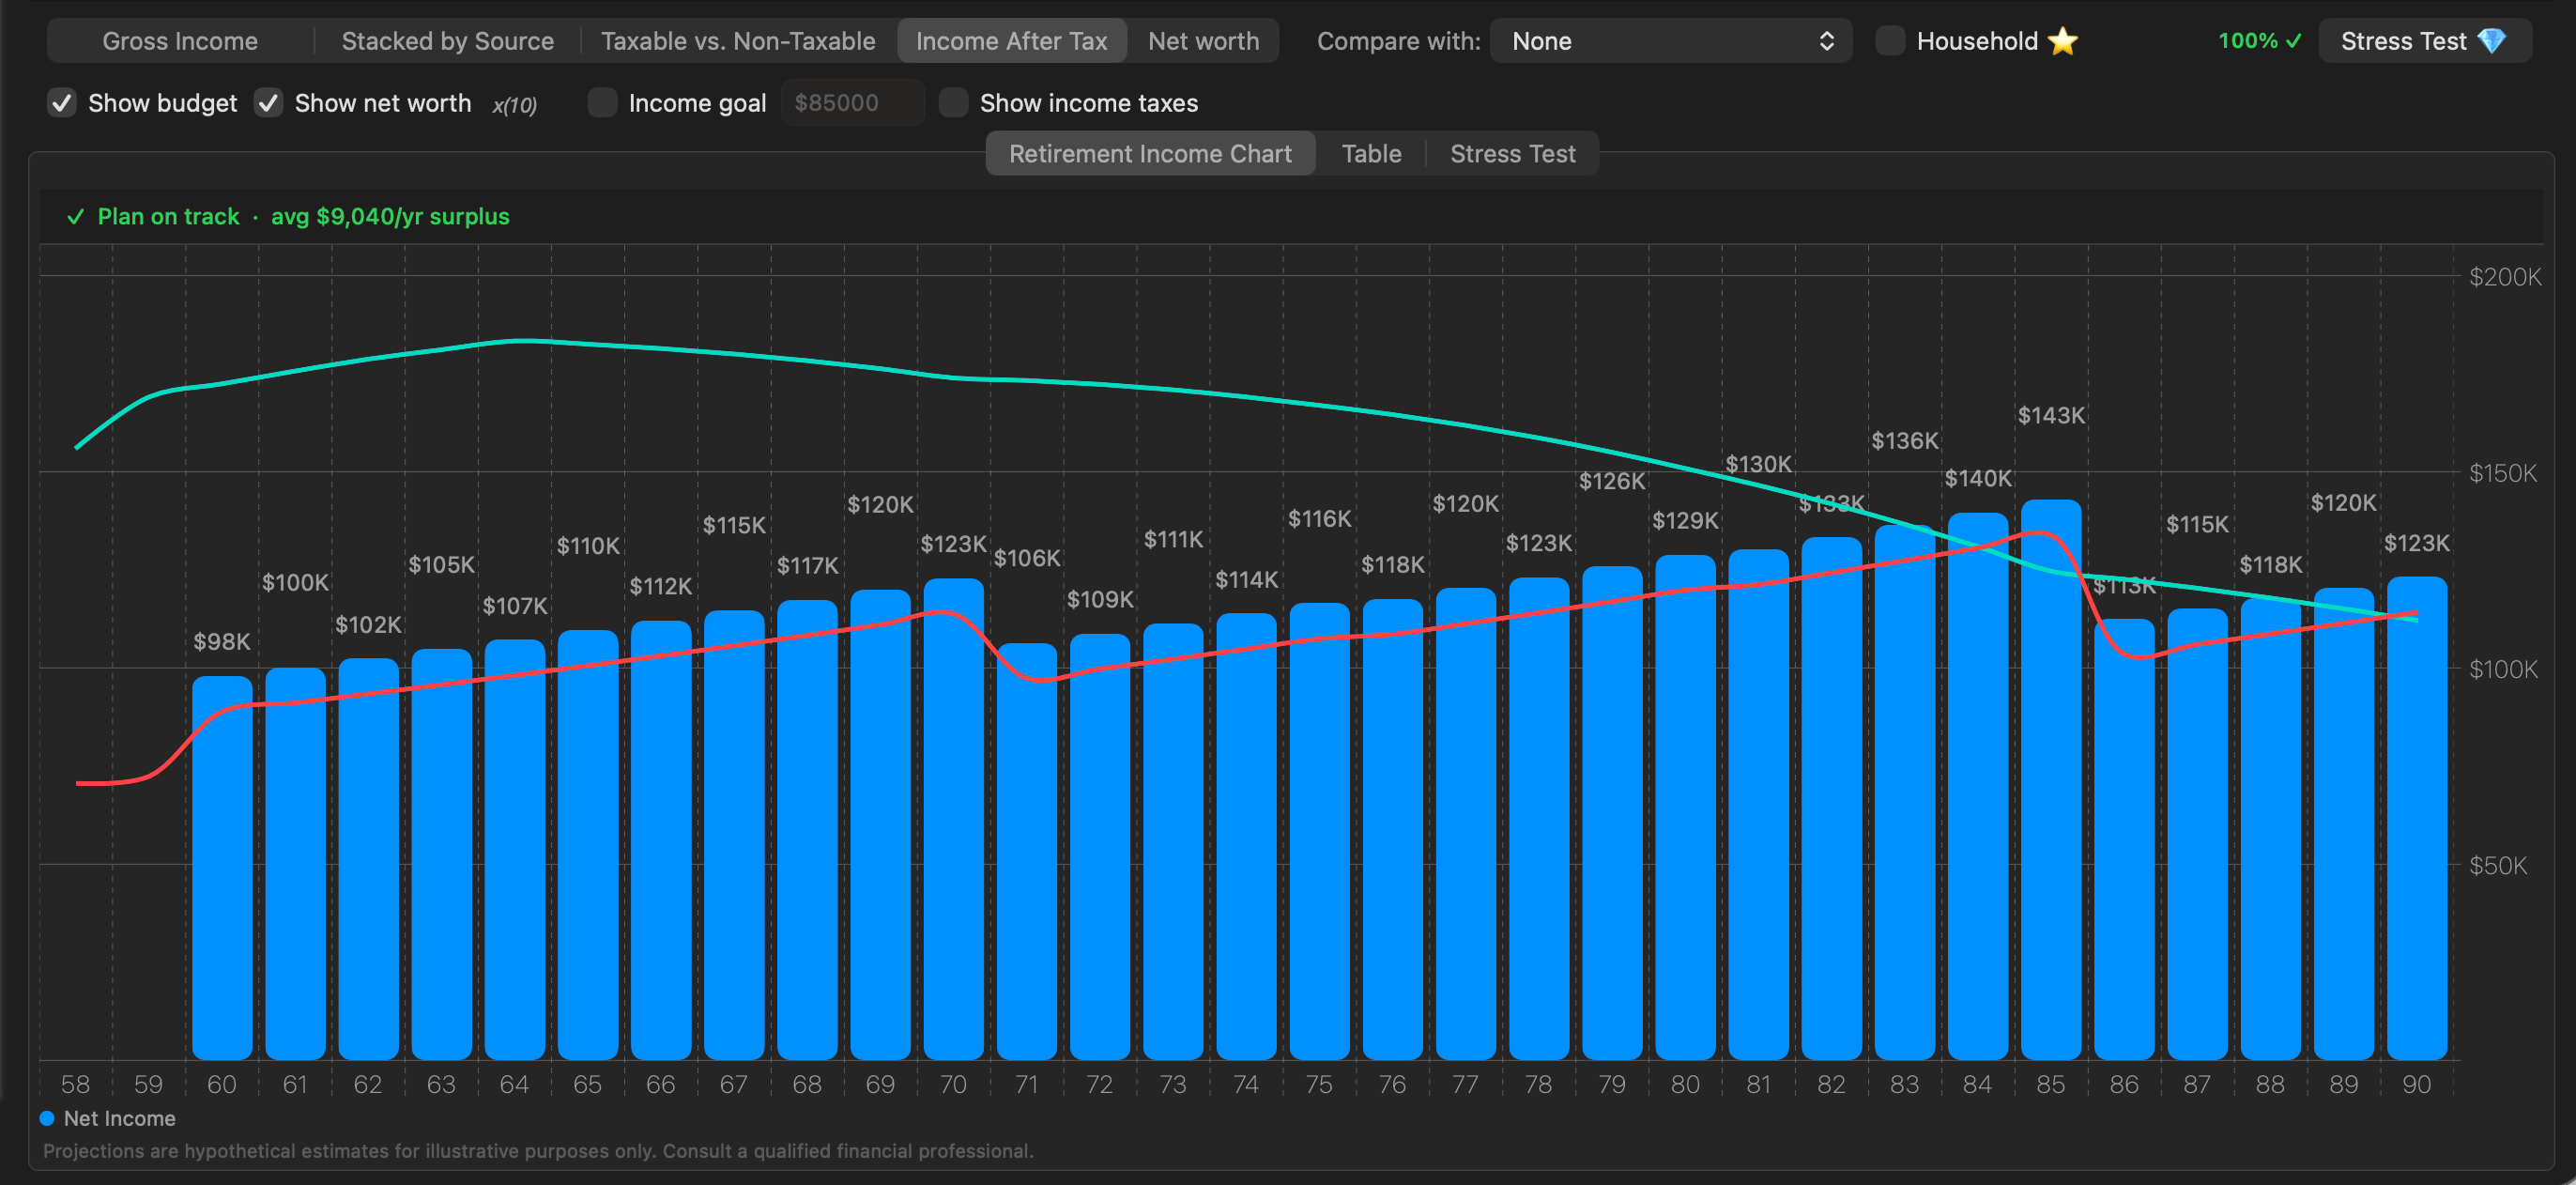
Tabs Below the chart, three tabs provide different views of the same data:
- Chart — the primary graphical projection view
- Table — a year-by-year numeric breakdown of all income sources, taxes, and net worth, with export and PDF report options
- Stress Test — the Monte Carlo simulation results for the current strategy (Pro and Advisor subscribers)
Chart Type Controls A segment control above the chart lets you switch between five chart views: Total income, Stacked by income source, Taxable income, After-tax income, and Net worth. These are described in detail in Section 8.
Keyboard and Menu All major actions are also accessible through the application menu bar. Common shortcuts follow standard macOS conventions.
2.4 Quick Start — Your First Client and Strategy#
This walkthrough takes you from a blank application to a working retirement projection in a few minutes.
Step 1 — Add a Client
Click the + button at the bottom of the sidebar to create a new client. A form will appear asking for the client’s basic information.
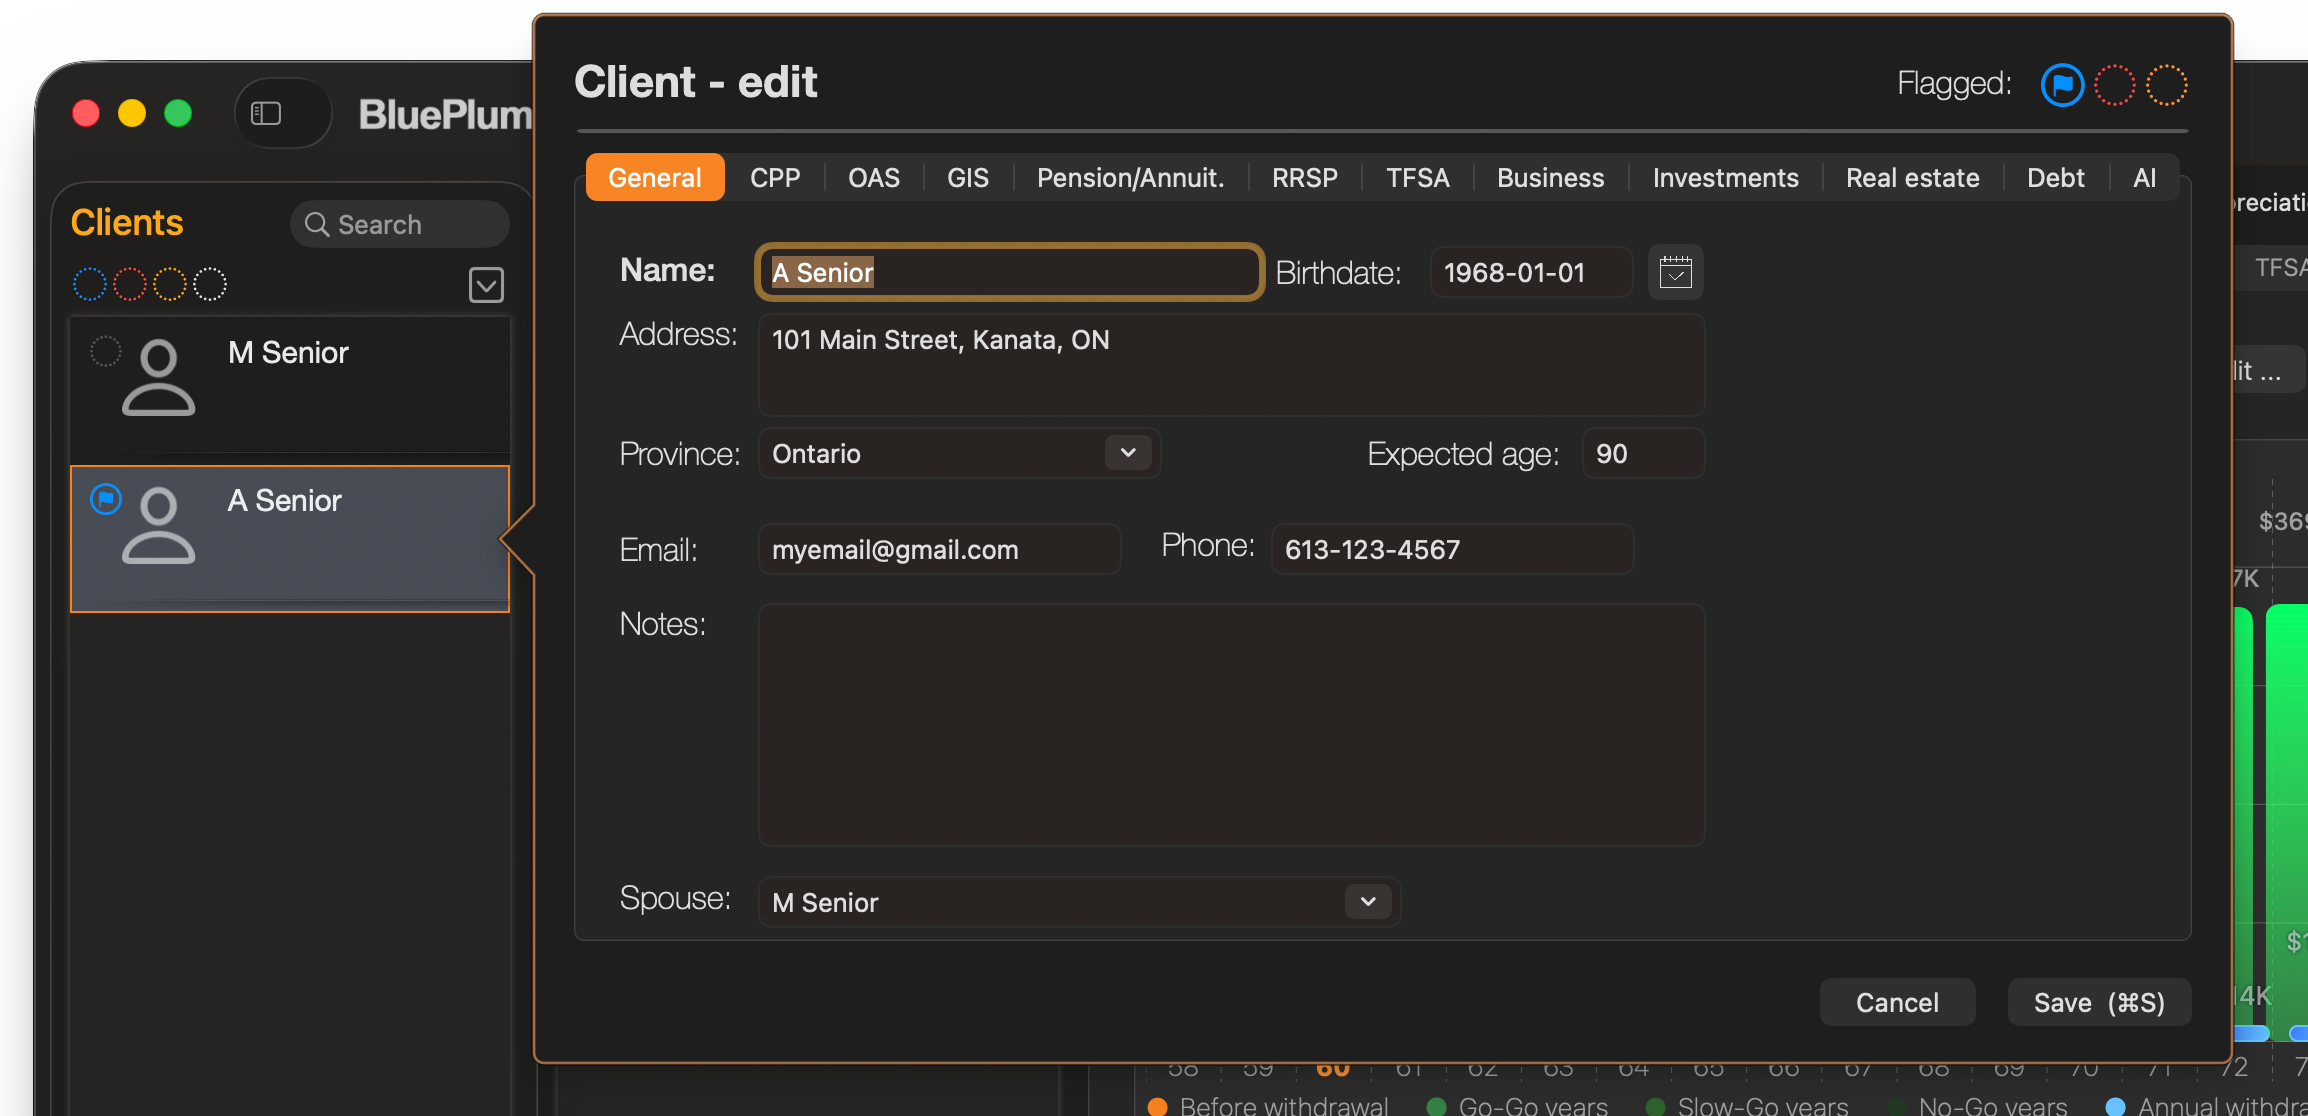
The top of the form contains the client’s profile fields - General tab:
- Name — the client’s full name, used on charts and in the PDF report.
- Birthdate — used to calculate the client’s current age and align all projections to the correct ages. Both partners must have a birthdate set to use Household mode.
- Province of Residence — determines which provincial tax brackets and credits apply. Select the province where the client lives, or plans to live, in retirement.
- Expected Age — the planning horizon, not a prediction of lifespan. A value of 90 or 95 is common to ensure the plan accounts for a long retirement.
- Email — client’s email.
- Phone — client’s phone.
- Notes — general notes you want to add about the client.
Fill in as many fields as are known. You can return and update them at any time.
Step 2 — Enter Income Sources
The client form contains a tab for each income source. Each tab lets you enter the details for that specific source. You only need to fill in the tabs that apply — unused sources can be left at zero.

Here is a brief summary of each tab:
| Tab | What to enter |
|---|---|
| CPP | Expected monthly CPP benefit and the age you plan to start receiving it (60–70). |
| OAS | OAS start age (65, or deferred up to 70 for a higher monthly amount). Partial OAS for non-full-year residents. |
| GIS | Guaranteed Income Supplement — calculated automatically based on projected net income. No manual input required in most cases. |
| RRSP / RRIF | Current RRSP balance. The app models the conversion to a RRIF — by default at age 71, the legal deadline, though you can convert earlier — and calculates the minimum annual withdrawals that follow. |
| TFSA | Current TFSA balance. The app uses TFSA funds as a tax-free supplement in later retirement years. |
| Pension | Defined-benefit pension monthly amount, start age, and indexation. Also covers annuity and other guaranteed income. |
| Business | Business or self-employment income during retirement years. |
| Investments | Non-registered investment portfolio: current value and allocation. Returns are driven by the equity and bond rates set in the profile. |
| Real Estate | Individual properties: current value, mortgage details, appreciation rate, and the age at which each property is sold. |
| Debt | Outstanding loans and other liabilities, with their repayment schedule. |
| AI | Notes and context passed to the AI Withdrawal Strategy feature. |
Detailed instructions for each tab are provided in Section 6 — Entering Income Sources.
Step 3 — View the Chart
As you enter data, the income chart updates automatically and shows projected annual income from all sources from retirement start age to expected age.
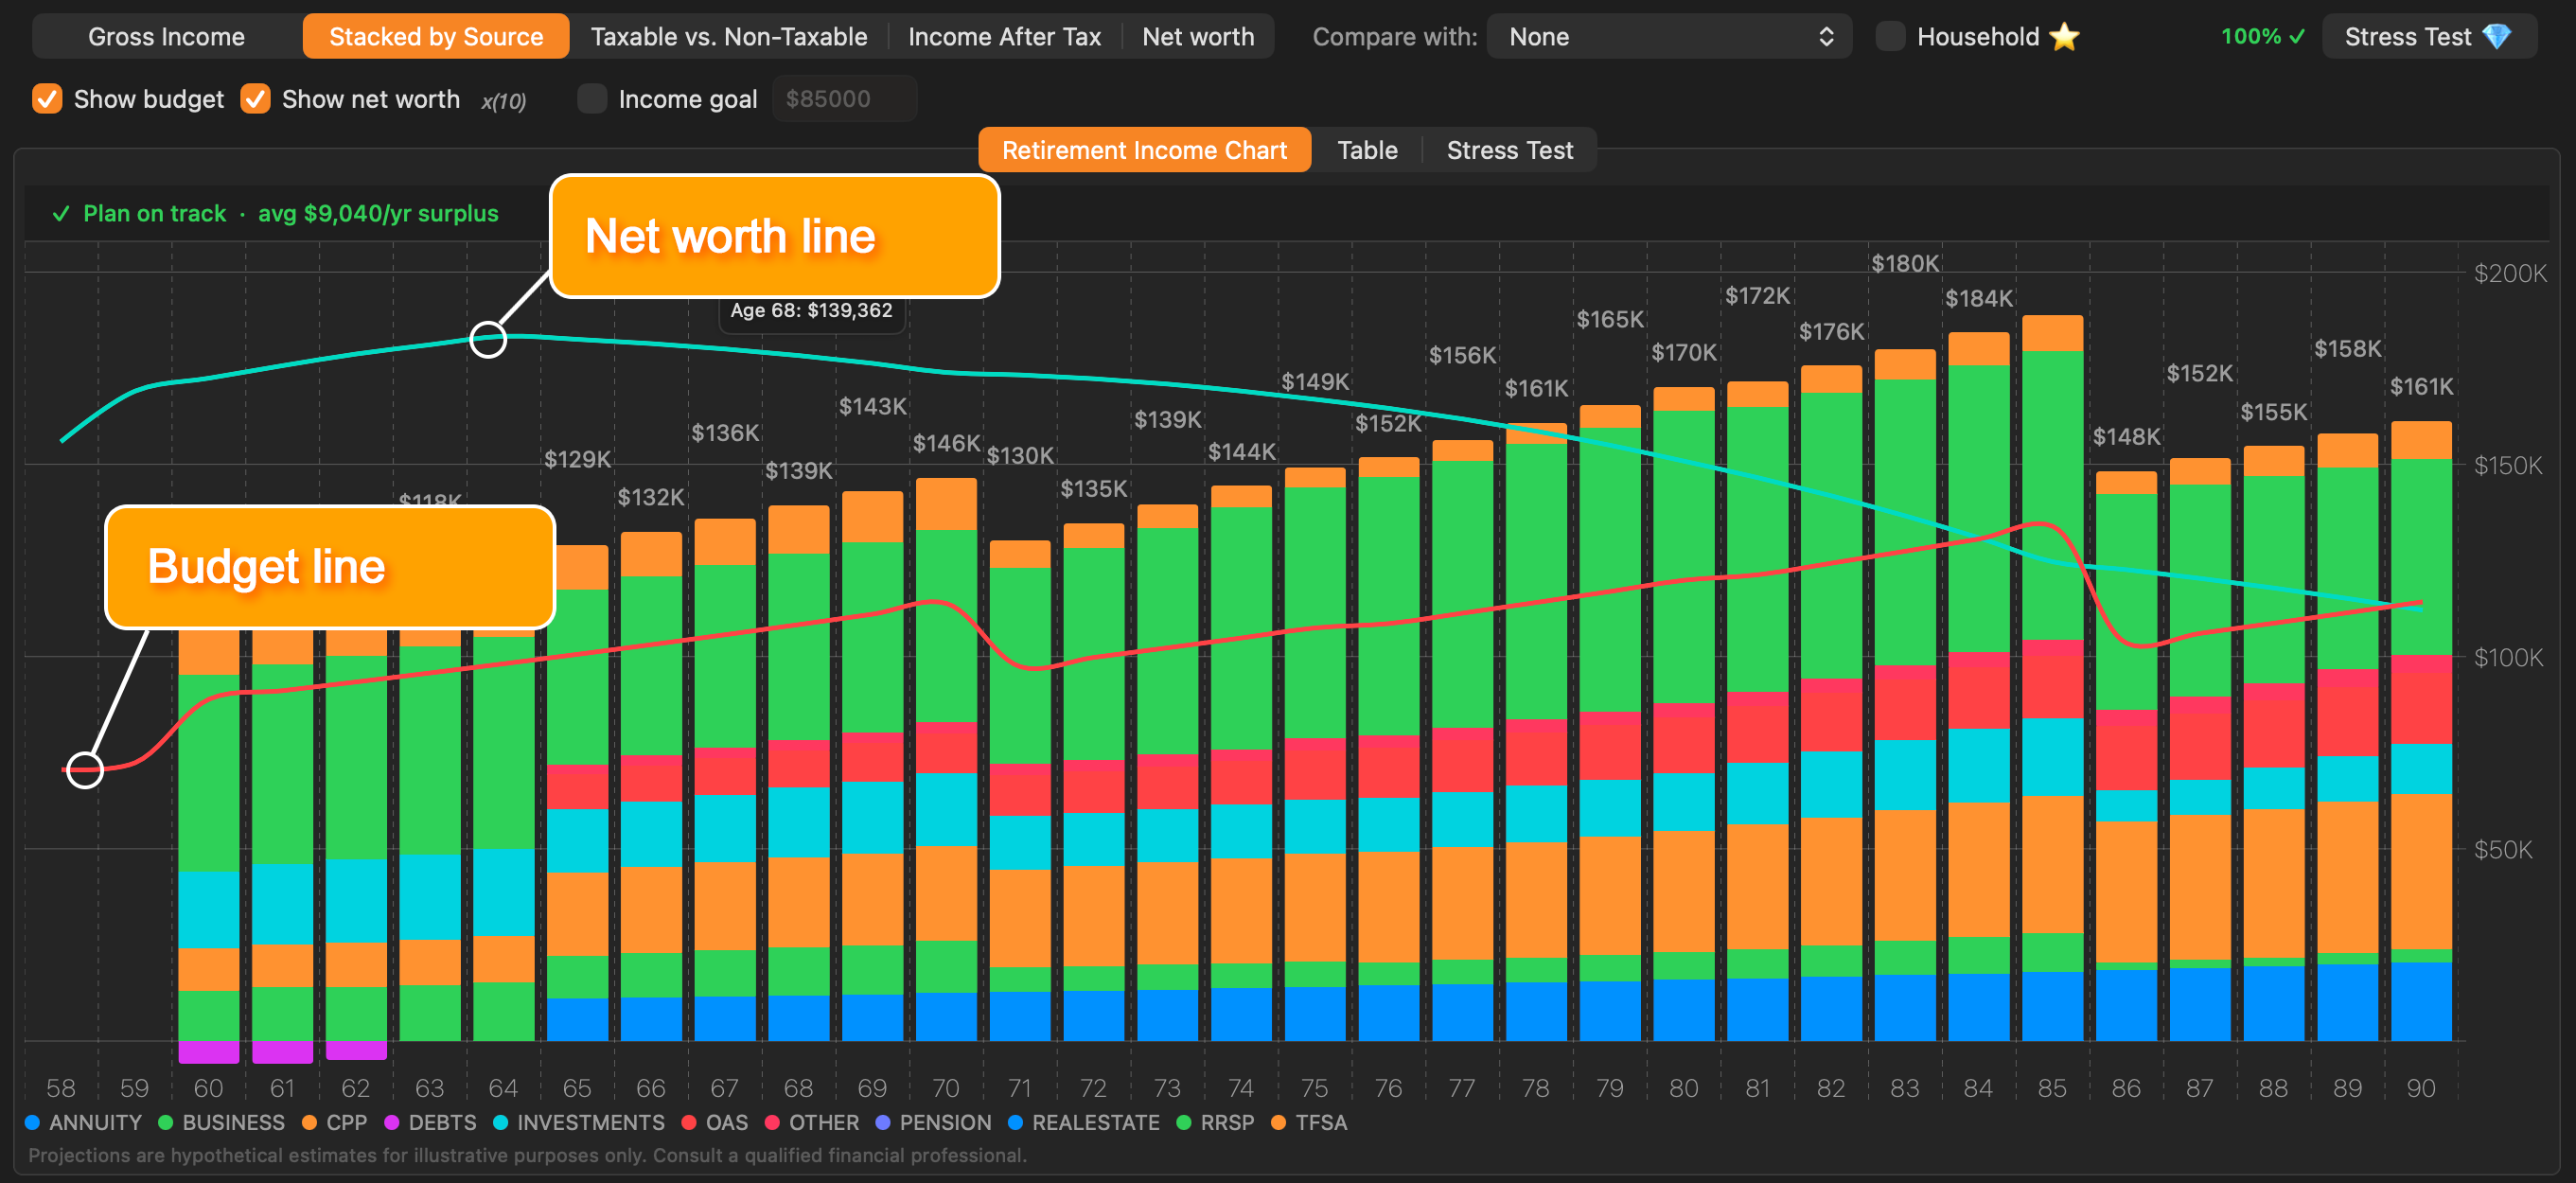
Switch to Net Worth in the chart type selector to see how your total assets are projected to change over time. The remaining net worth and projected budget can also be displayed by selecting the ‘Show budget’ and ‘Show net worth’ options. The net worth line is scaled to fit, and the scaling factor is displayed beside the ‘Show net worth’ checkbox (×10 in the image above).
You’re ready to explore. From here you can:
- Adjust any income source and watch the chart update in real time
- Switch to the Table tab for a year-by-year numeric breakdown
- Add a second strategy to compare two retirement scenarios side by side
- Run a Stress Test to see how resilient the plan is under uncertain market conditions (Pro / Advisor)
2.5 The Guided Tour#
The first time you launch Retirement Planner, a guided tour starts automatically. It walks through the whole application in sixteen short steps, highlighting one part of the interface at a time and explaining what it does.
What the tour covers
| Steps | Topic |
|---|---|
| 1 | Welcome and overview |
| 2–5 | The client list, the client profile General tab, simplified vs. detailed CPP entry, and savings balances |
| 6–7 | Creating multiple strategies and personalising each one |
| 8–13 | Each major income source in turn — CPP, OAS, GIS, RRSP/RRIF, TFSA — and the retirement budget |
| 14–15 | The combined income picture and the Experiments menu |
| 16 | Subscription plans |
How it works
The tour dims the application window and spotlights the control being described, with an explanatory callout beside it. Use Next and Back to move between steps, or Skip to leave at any point.
The tour runs against a temporary demo client with realistic sample figures, so you can see populated charts and tables before entering any data of your own. This demo client exists only while the tour is running — it is never saved, and it will not appear in your client list afterwards. Nothing you do during the tour affects your real data.
If you quit part-way through, the tour resumes at the step you left off.
Running the tour again
Once completed or skipped, the tour does not reappear on subsequent launches. To see it again, open Preferences → General and check Show the application intro screen on the next start, then restart the app.
 Blue Plum Software