Press Kit — Retirement Planner for Mac
Retirement Planner for Mac Brings Professional-Grade Canadian Retirement Modelling to Individuals and Advisors
New macOS app delivers instant, tax-accurate retirement income projections, AI-assisted withdrawal planning, and polished client reports — built entirely around the Canadian tax and benefit system.
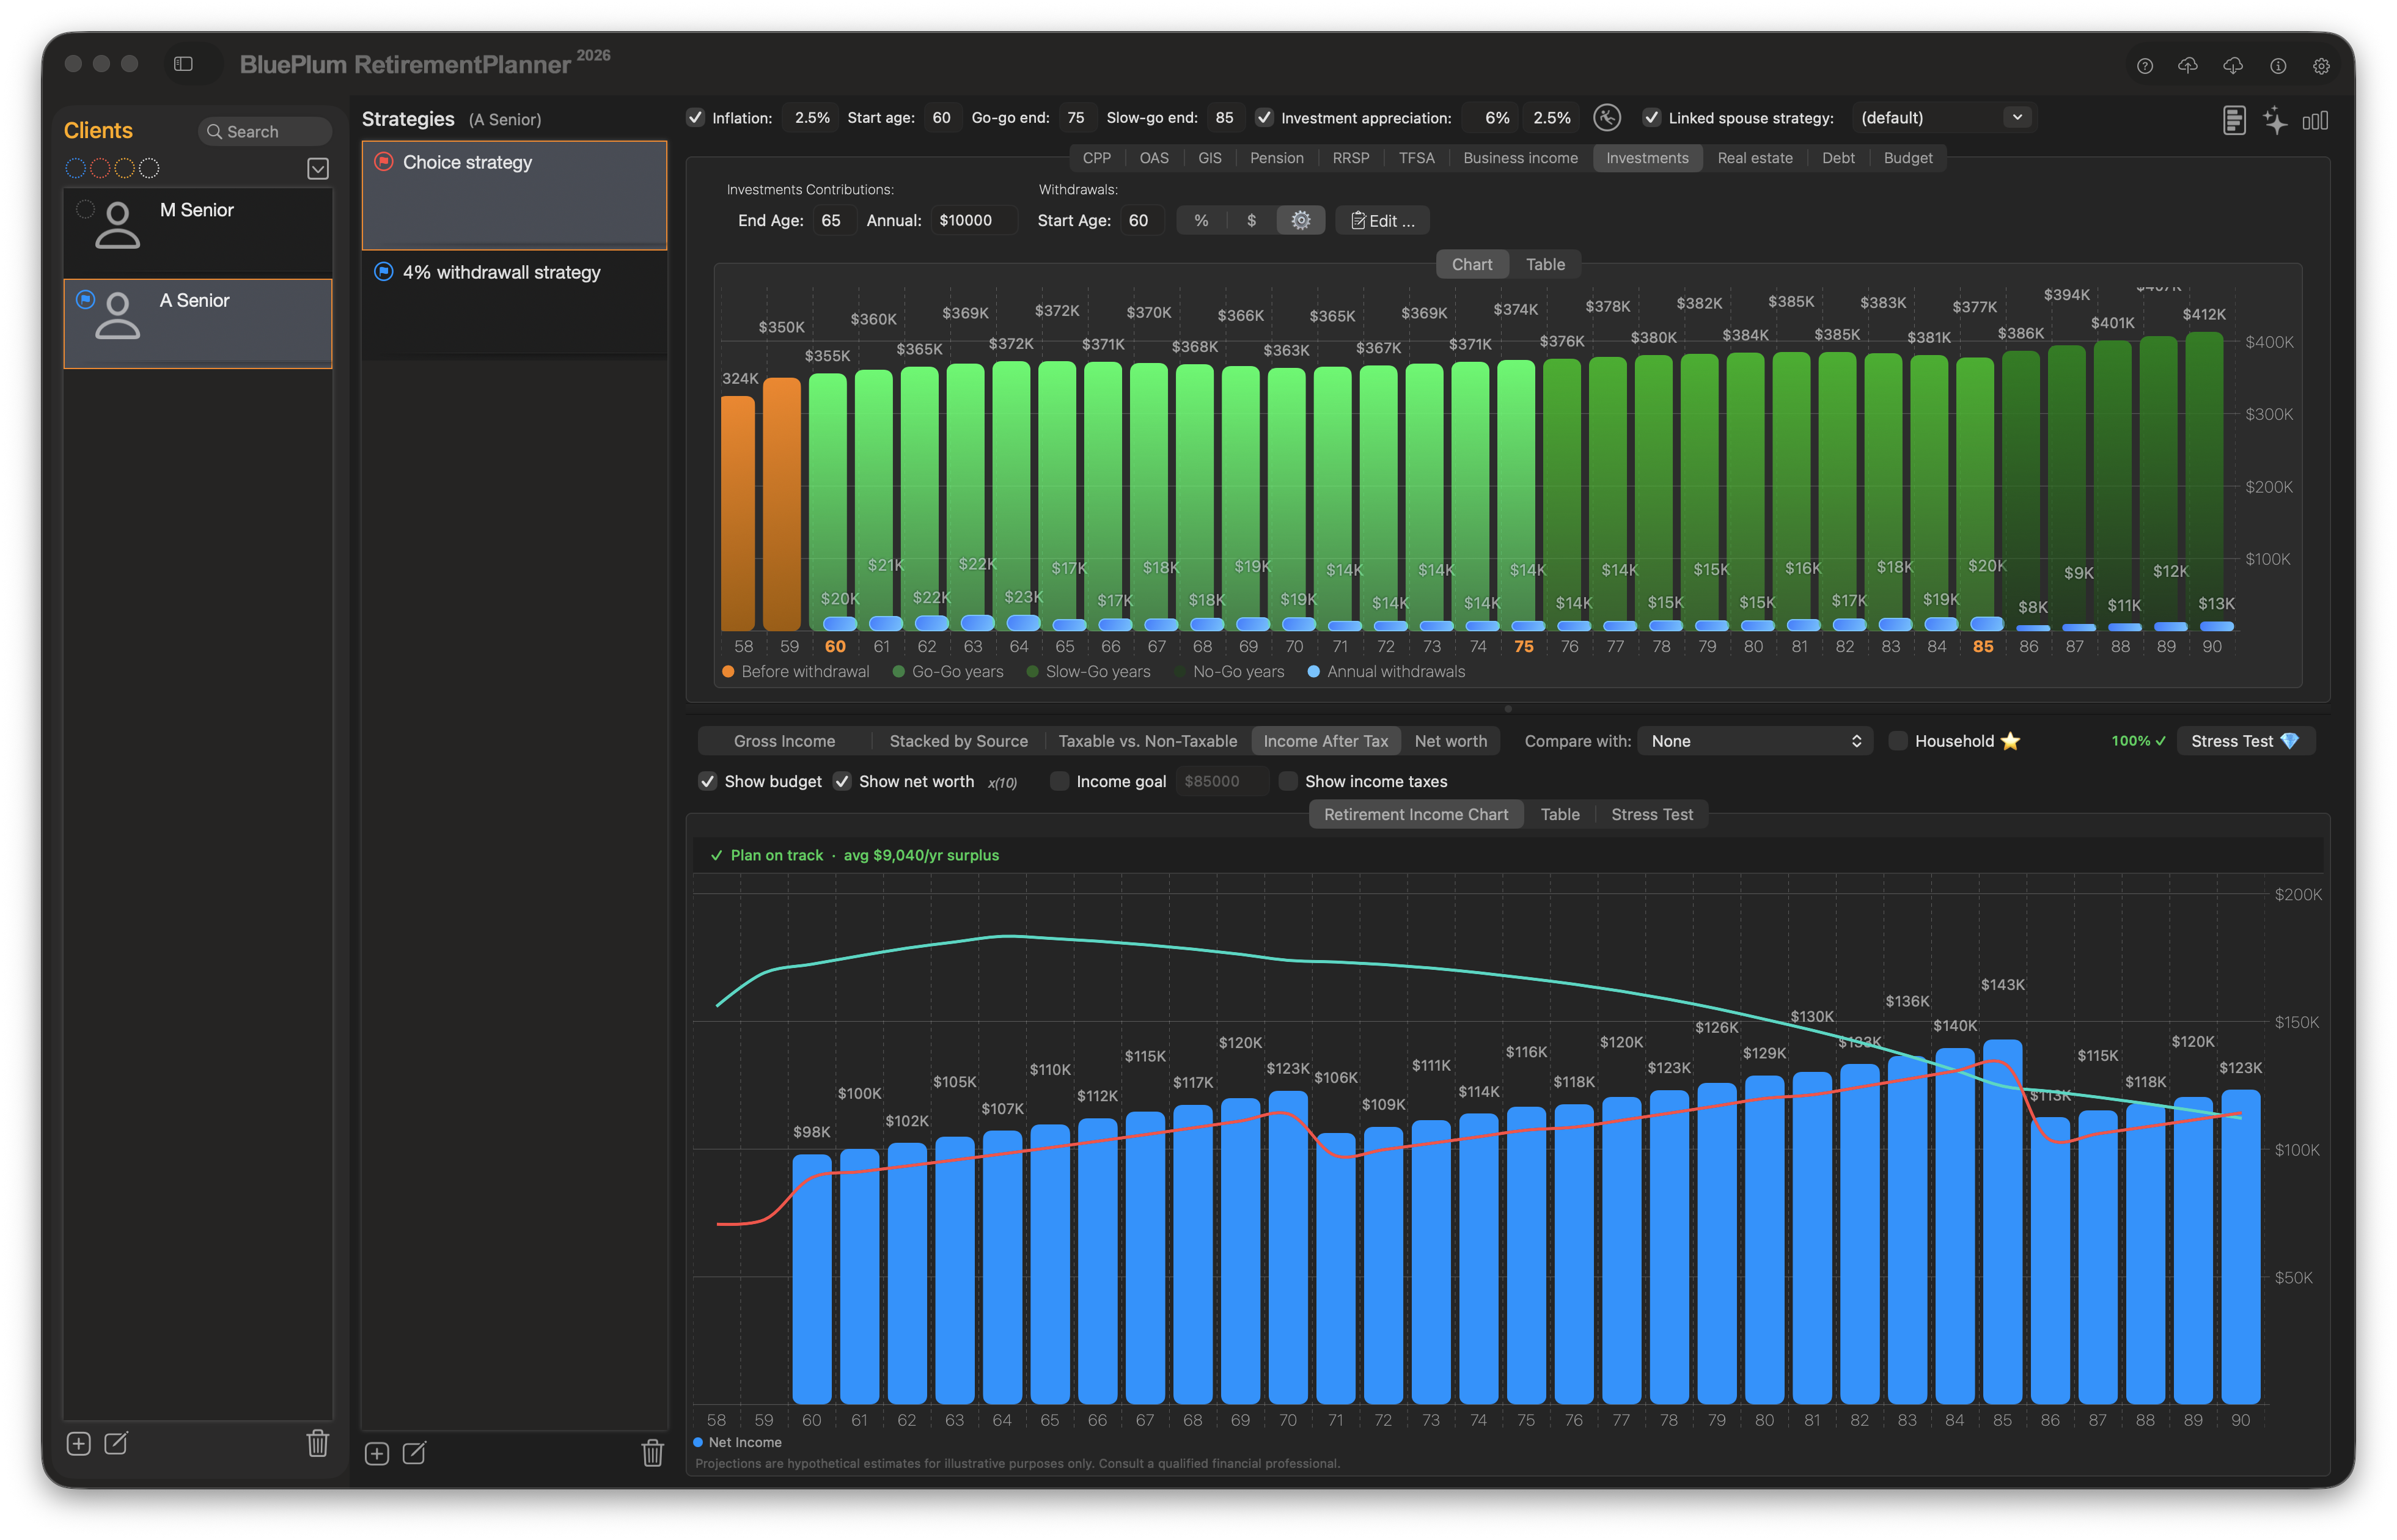
Retirement Planner — full application window showing the income chart, sidebar client list, and strategy selector.
Toronto, Ontario — March 2026 — Blue Plum Software Inc. today announced the launch of Retirement Planner, a powerful macOS application that gives Canadians a clear, detailed picture of their retirement income — before and after tax. Designed for both individuals planning their own retirement and financial advisors working with clients, Retirement Planner models every major Canadian income source — CPP, OAS, GIS, RRSP/RRIF, TFSA, pensions, investments, real estate, and business income — and projects the results instantly on an interactive chart.
The application is available on the Mac App Store. The Personal plan is free. Pro and Advisor plans are available by subscription and unlock advanced features including Monte Carlo stress testing, AI-assisted withdrawal planning, household income optimisation, and pension income splitting.
The Problem Retirement Planner Solves
Most retirement planning tools treat Canadian users as an afterthought. Generic calculators ignore CPP enhancement rules, OAS clawback thresholds, GIS means-testing, and the interaction between provincial and federal tax credits that determines what a retiree actually takes home each month. Spreadsheets can model these rules, but building and maintaining one requires expertise most people do not have — and most advisors do not have time for.
Retirement Planner was built from the ground up for Canada. Federal and provincial income tax, the age credit, the pension income credit, OAS clawback, CPP enhancement, and GIS eligibility are all modelled using the current year's published parameters — and updated automatically in the background as those parameters change. The result is projections that reflect a Canadian retiree's real after-tax income, not a generic estimate that ignores the details that matter most.
Key Features
Instant, Accurate Projections
Enter a client's income sources once. The chart updates in real time as any value changes — no recalculate button, no waiting. Age ranges span from the current age to a configurable plan end age, with every year of projected income shown as a bar chart broken down by source. Hover over any bar or band for an exact dollar tooltip.
Five chart types — Gross Income, Stacked by Source, Taxable vs. Non-Taxable, After-Tax Income, and Net Worth — selectable from the toolbar.
Canadian Tax Precision
- Federal and provincial income tax calculated for all provinces and territories
- Age Amount and Pension Income credits applied automatically
- OAS Recovery Tax computed year-by-year based on net income
- GIS eligibility and benefit amounts means-tested against projected income
- CPP enhancement (post-2019 CPP2) modelled separately from base CPP
- Ontario surtax and health premium
- Tax parameters fetched automatically — no manual updates ever required
Multiple Strategies, Side-by-Side Comparison
Create multiple retirement scenarios for the same client and compare them on the same chart. The primary strategy shows as bars; the comparison strategy traces a yellow line on the same axis. Instantly see what changes when CPP is taken at 60 versus 70, or when RRSP withdrawals are front-loaded versus deferred. The Table view in comparison mode adds side-by-side Gross / Taxes / Net Income columns for both strategies.
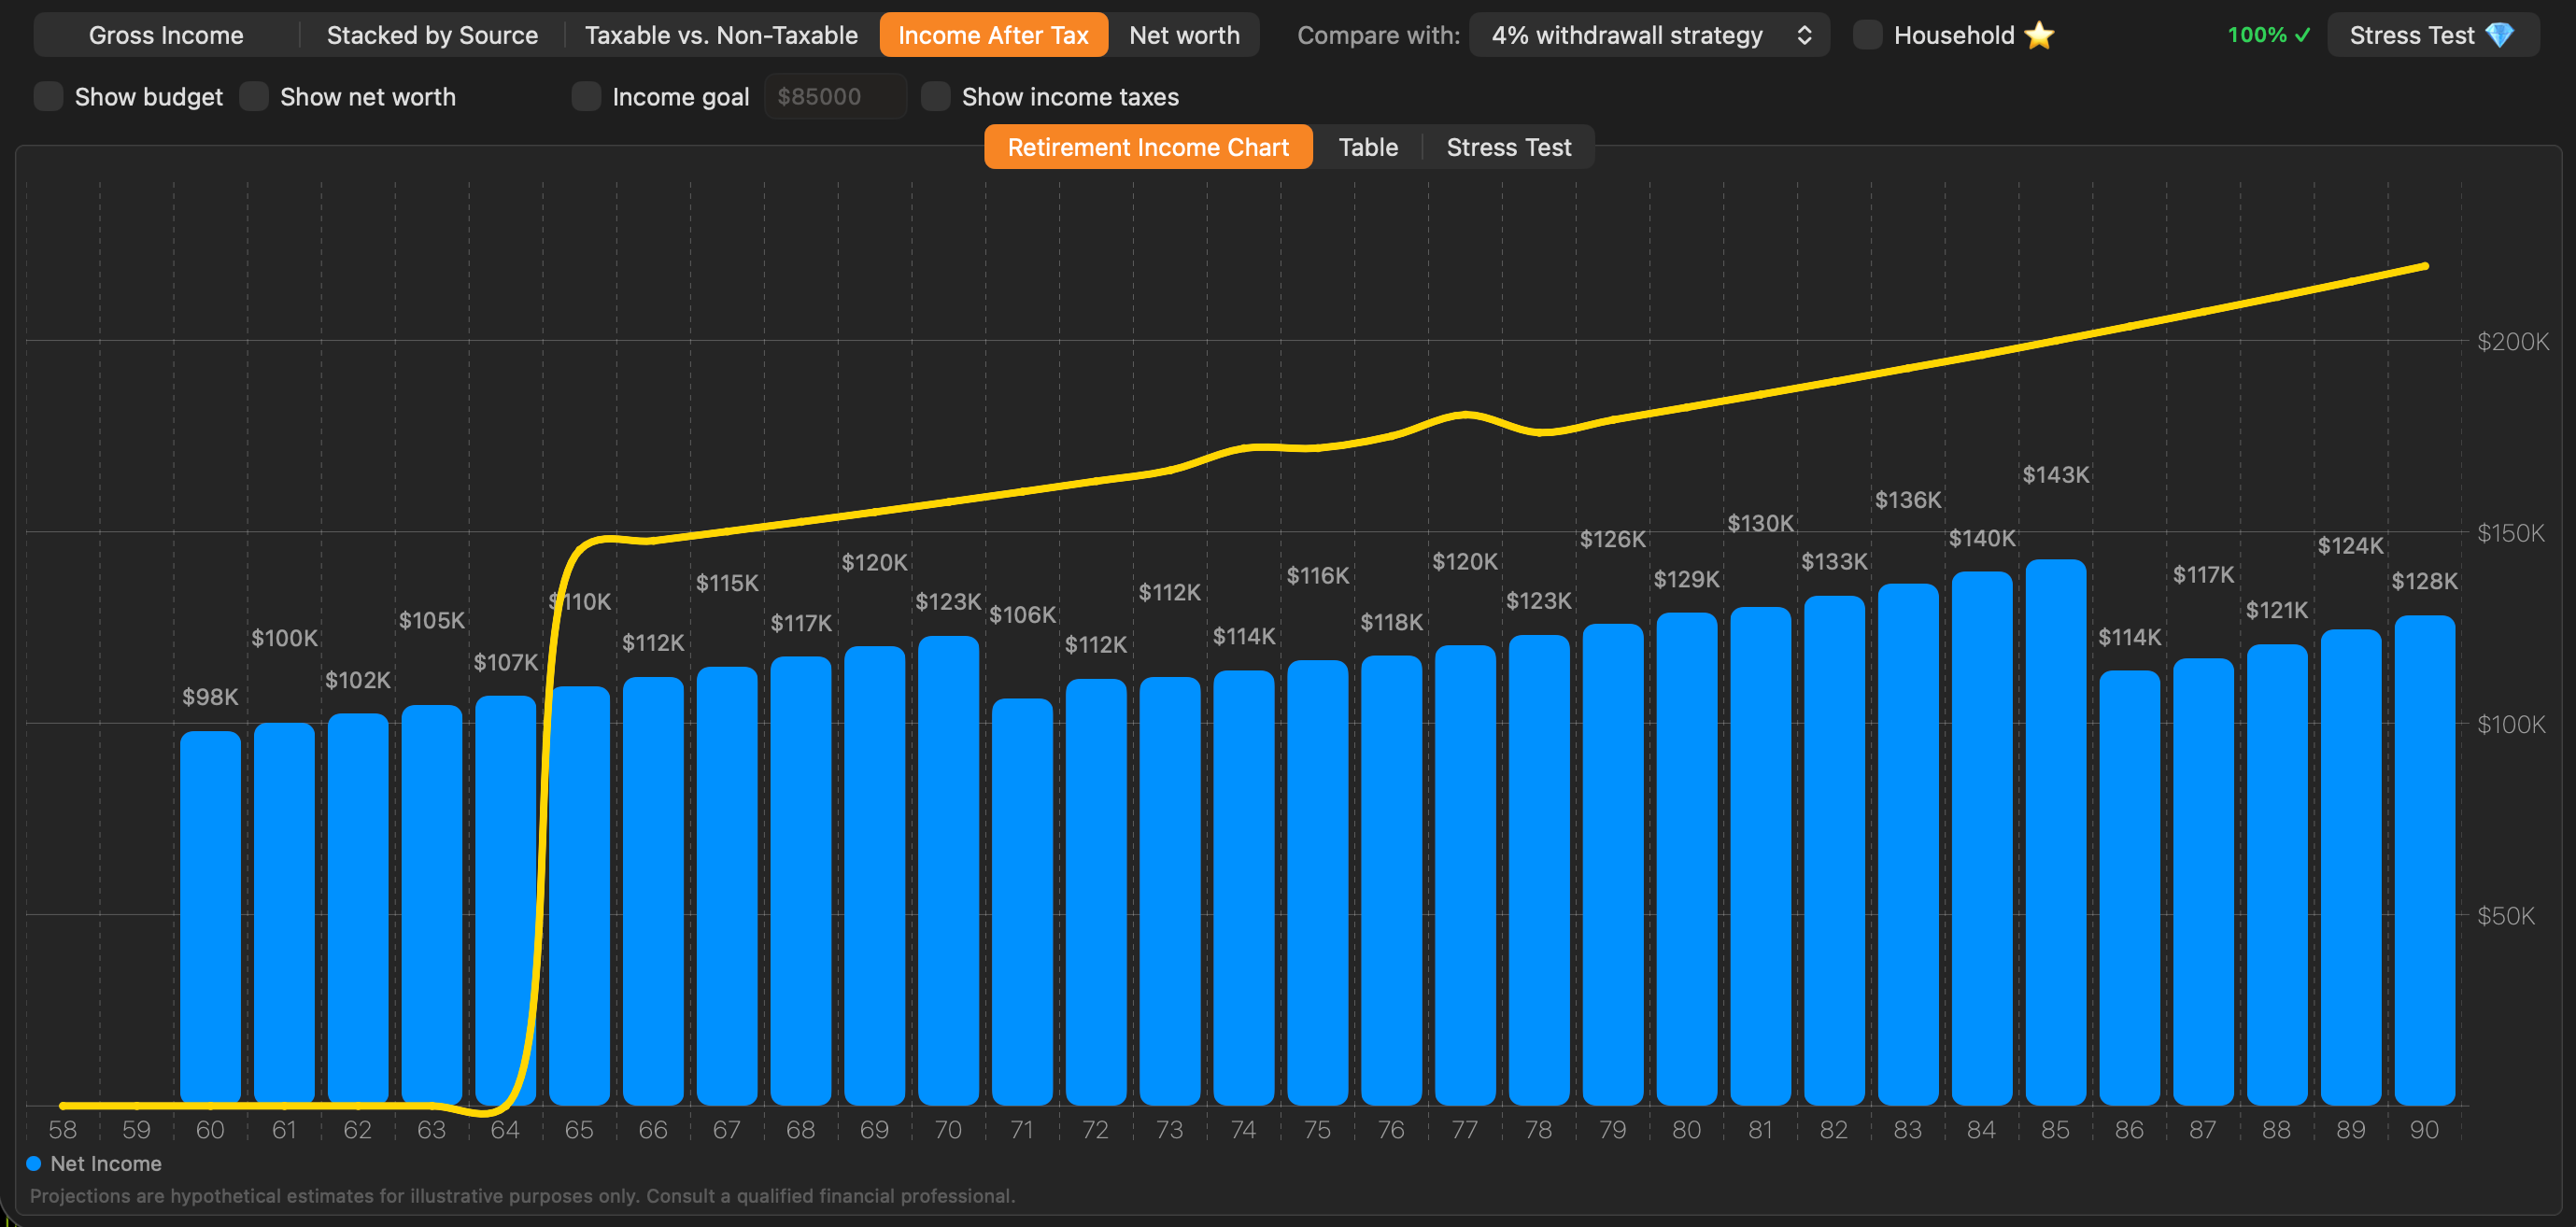
Two strategies compared on a single chart — bars for the primary strategy, yellow line for the comparison.
Household Mode with Pension Income Splitting
Link two clients as spouses and switch to Household Mode to view combined income, combined after-tax cash flow, and the tax savings available through pension income splitting. The app automatically finds the split of eligible pension income — RRIF withdrawals and DB pension payments at age 65 and older — that minimises the couple's combined tax bill, displaying the annual saving as a dedicated row in the household table.
Household mode showing combined income and the tax saving from pension income splitting.
Monte Carlo Stress Test
Run 500 to 5,000 simulated retirement scenarios with randomised return and inflation assumptions to determine the probability of success. A fan chart displays the full distribution of outcomes (10th to 90th percentile) alongside the deterministic projection. A success-rate badge reports what percentage of scenarios the plan survived — using the user's choice of definition: net worth never reaching zero, or income meeting the budget in every year.
The Monte Carlo fan chart — P10 to P90 shaded bands, median line, and deterministic dashed line — with the success-rate badge.
AI-Assisted Withdrawal Planning
Pro and Advisor subscribers can invoke an AI model (currently Anthropic Claude) to analyse a client's full financial profile and recommend an optimal year-by-year withdrawal sequence. The AI optimises for after-tax efficiency — minimising lifetime tax, preserving GIS eligibility, and avoiding OAS clawback — and explains its reasoning in plain language before the user applies the result. No personally identifiable information is sent; only financial figures and ages.
Automatic Withdrawal Adjustment
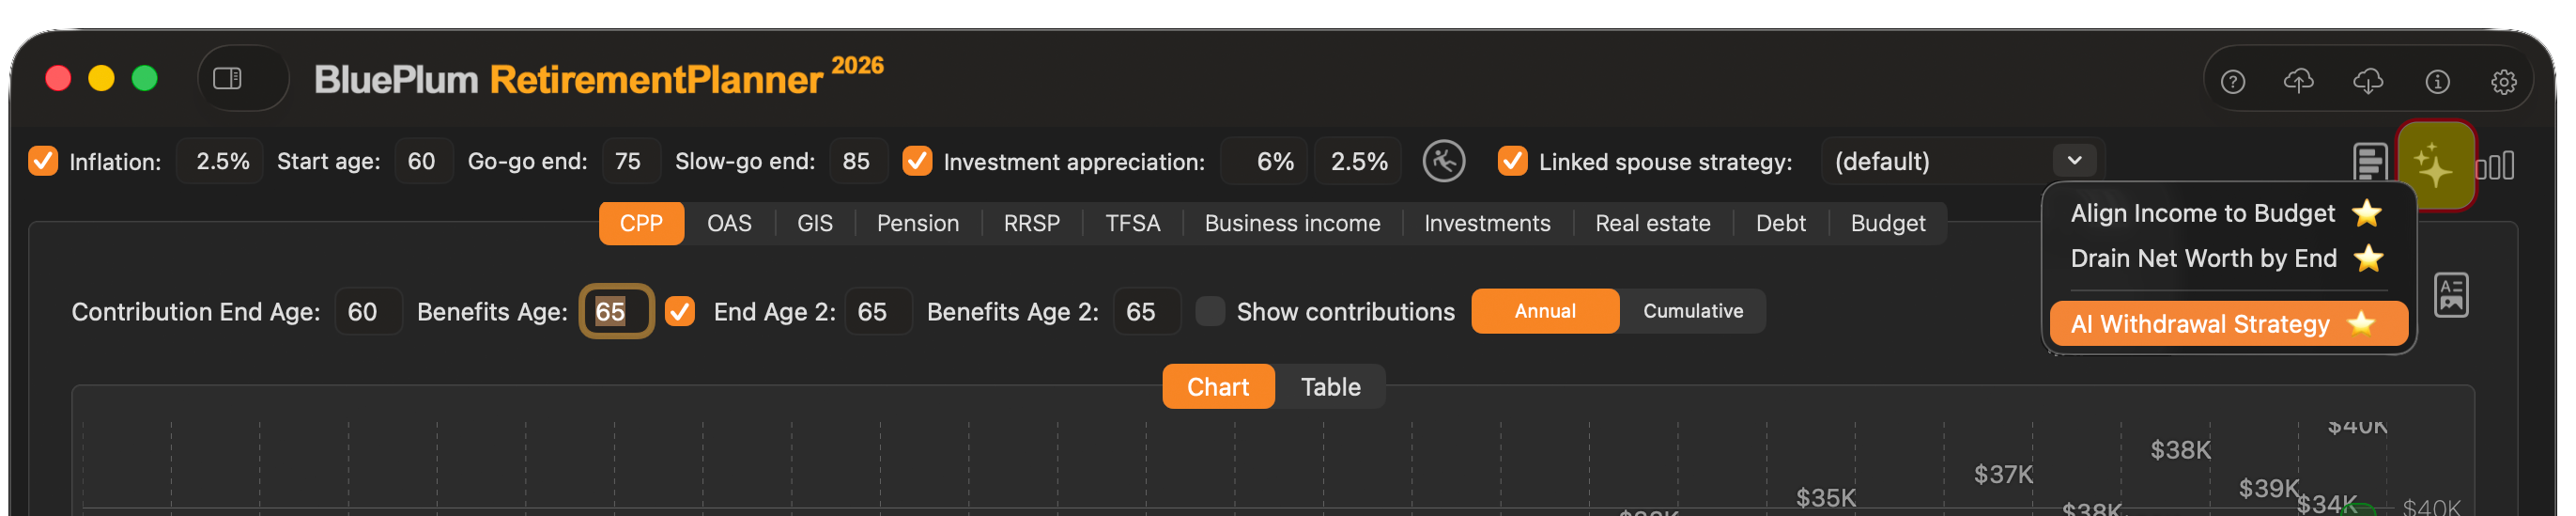
Three one-tap commands handle the heavy lifting: Align Income to Budget automatically calculates withdrawals so after-tax income tracks the budget line in every year. Drain Net Worth by End spreads drawdown so the portfolio reaches zero at the plan end age. AI Withdrawal Strategy applies an AI-optimised year-by-year sequence with a full explanation.
Professional Client Reports
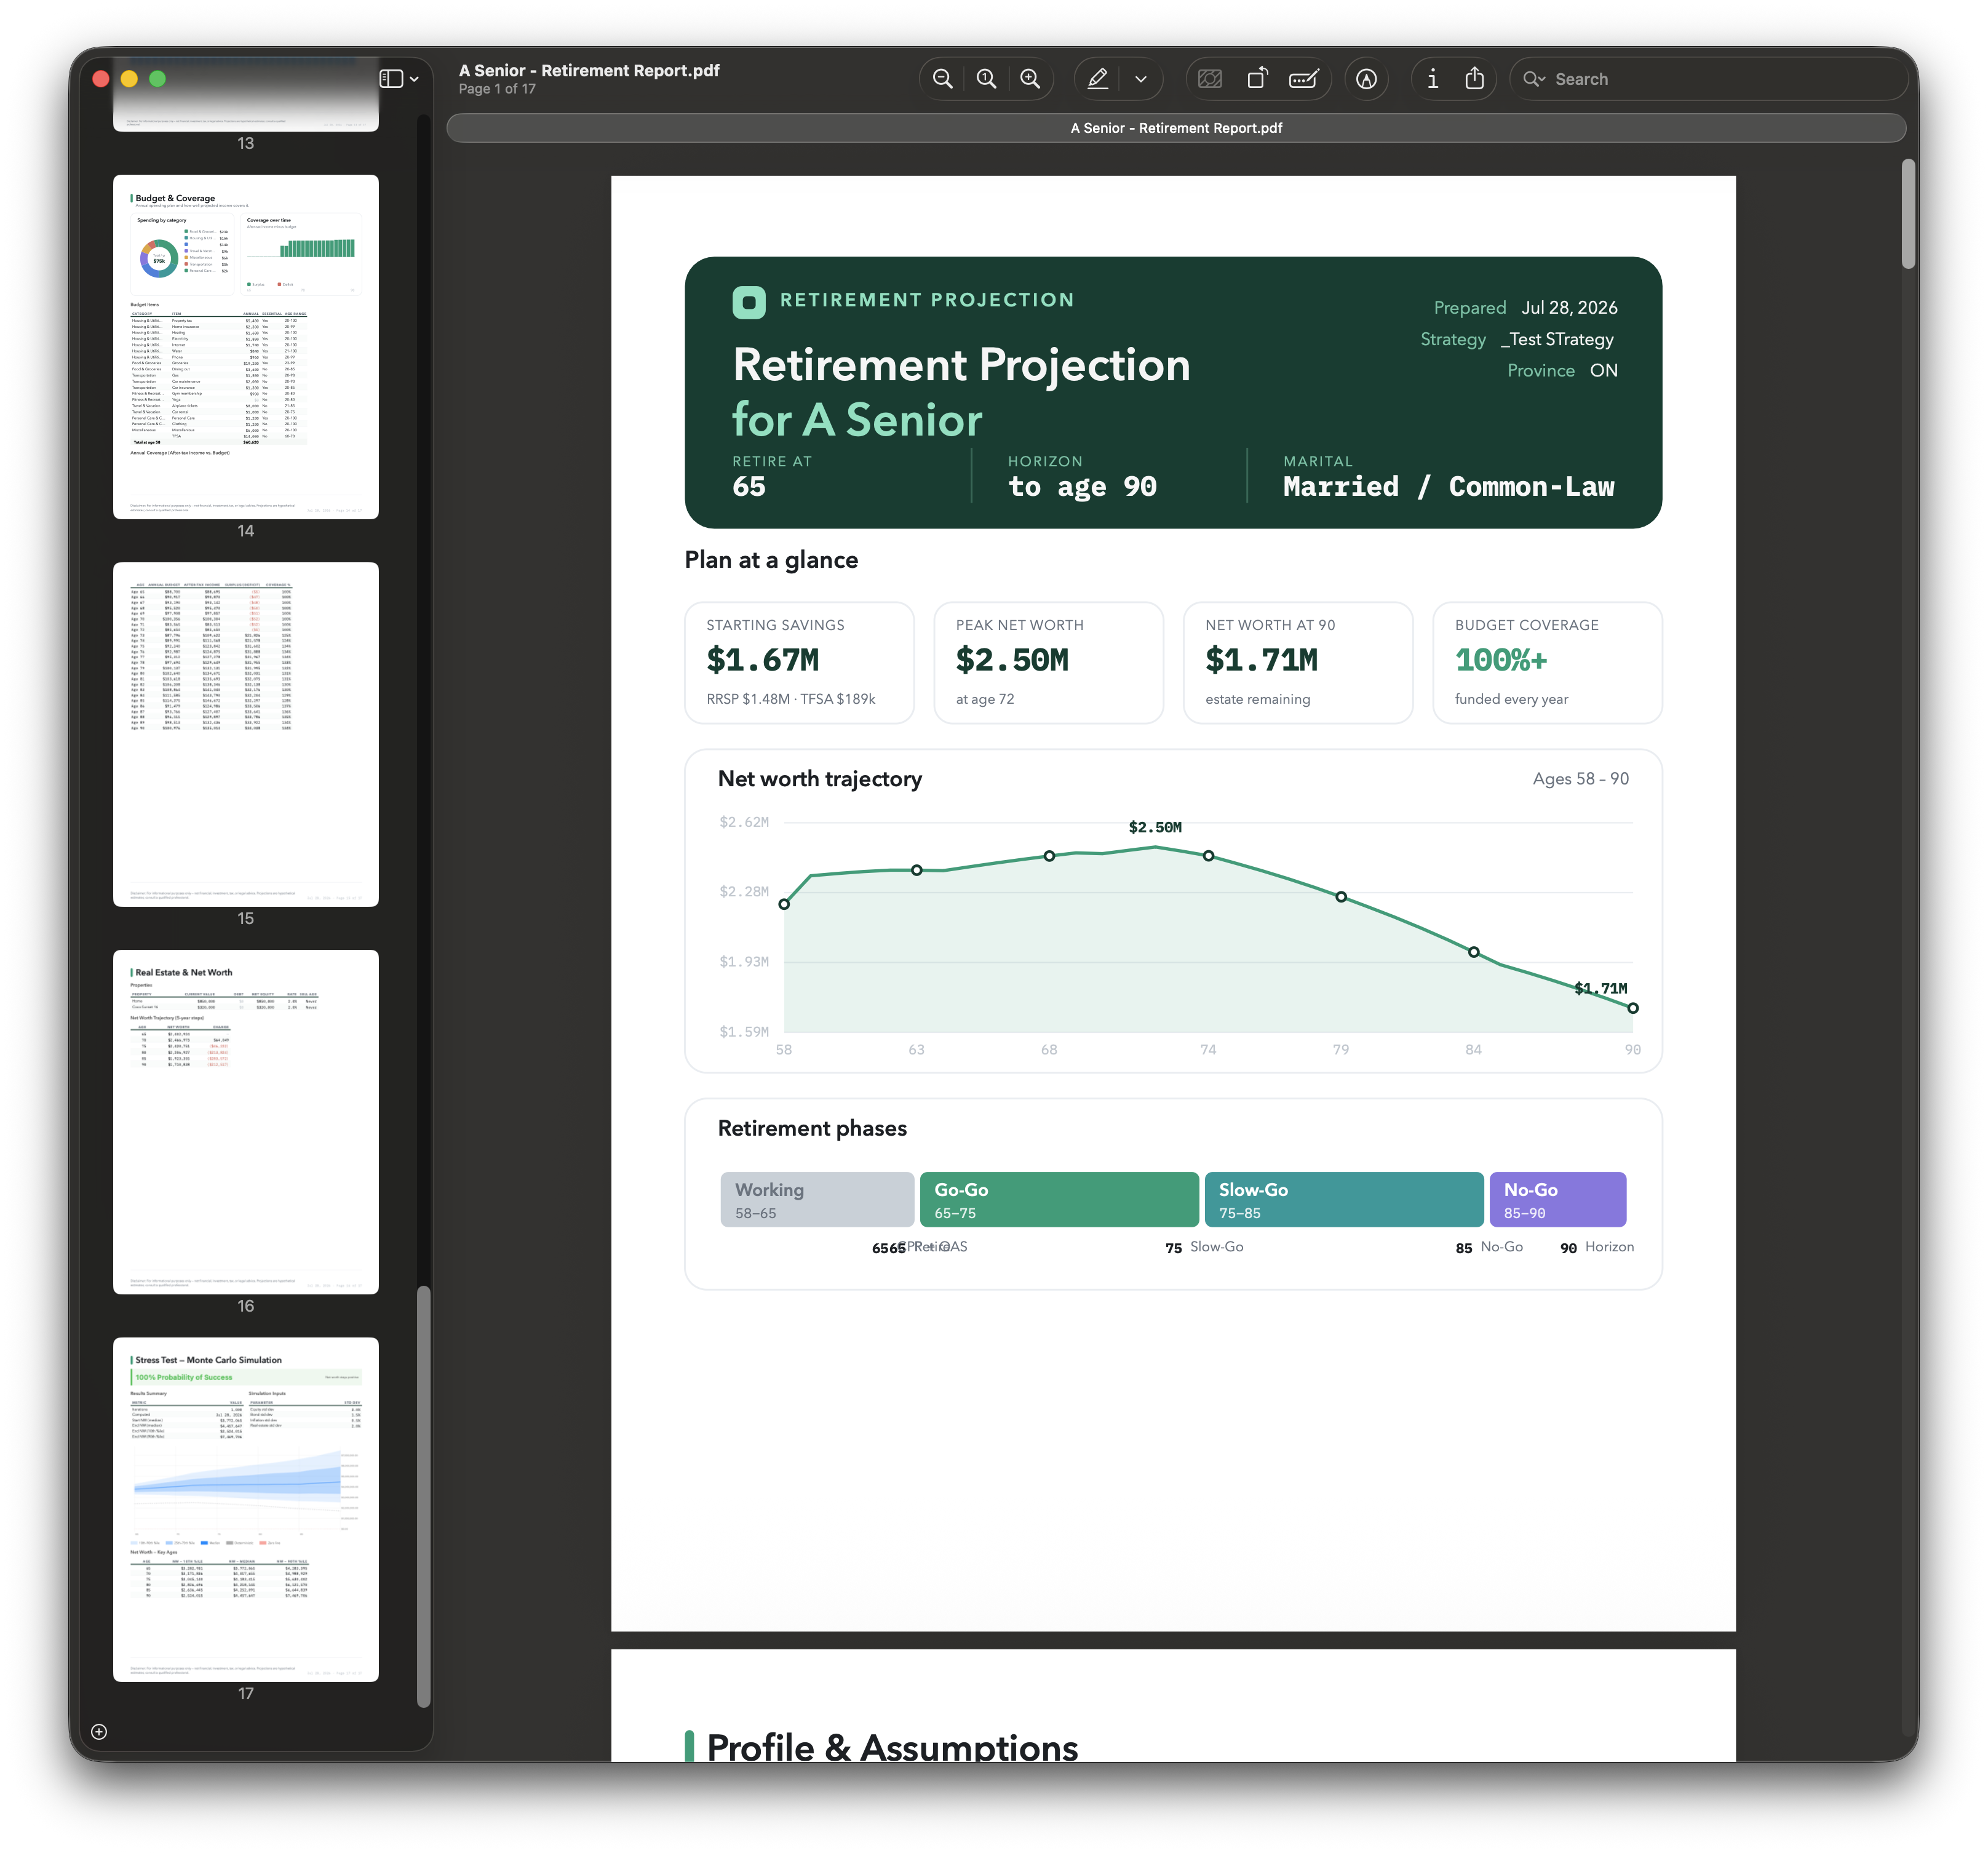
Generate a multi-section, print-ready PDF report with one click. Reports include a cover page, client profile and strategy assumptions, year-by-year income projections, budget coverage analysis (surplus or shortfall per year), real estate and net worth trajectory, and — when stress test results are available — a full Monte Carlo section with fan chart and percentile table.
Subscription Plans
Retirement Planner is available in three tiers to suit individuals and professionals alike.
| Feature | Personal | Pro ⭐ | Advisor 💎 |
|---|---|---|---|
| Core projections & Canadian tax | |||
| All income source tabs | |||
| PDF client report | |||
| Clients | 1 | Up to 2 | Unlimited |
| Strategies per client | 1 | Up to 3 | Unlimited |
| Side-by-side strategy comparison | |||
| Household mode | |||
| Pension income splitting | |||
| Monte Carlo stress test | |||
| Align income to budget | |||
| Drain net worth by end | |||
| Optimize withdrawal sequence | |||
| AI withdrawal strategy |
Personal is suited to individuals building and monitoring their own retirement plan. Pro unlocks every analytical feature for power users and couples. Advisor removes all client and strategy limits for financial professionals managing a book of clients.
"Retirement planning in Canada is genuinely complex — the interaction between CPP timing, OAS clawback, GIS eligibility, and provincial tax can add or cost a retiree tens of thousands of dollars over a lifetime. Retirement Planner makes that complexity navigable for anyone, whether you are planning your own retirement at the kitchen table or advising a room full of clients."
Additional Screenshots
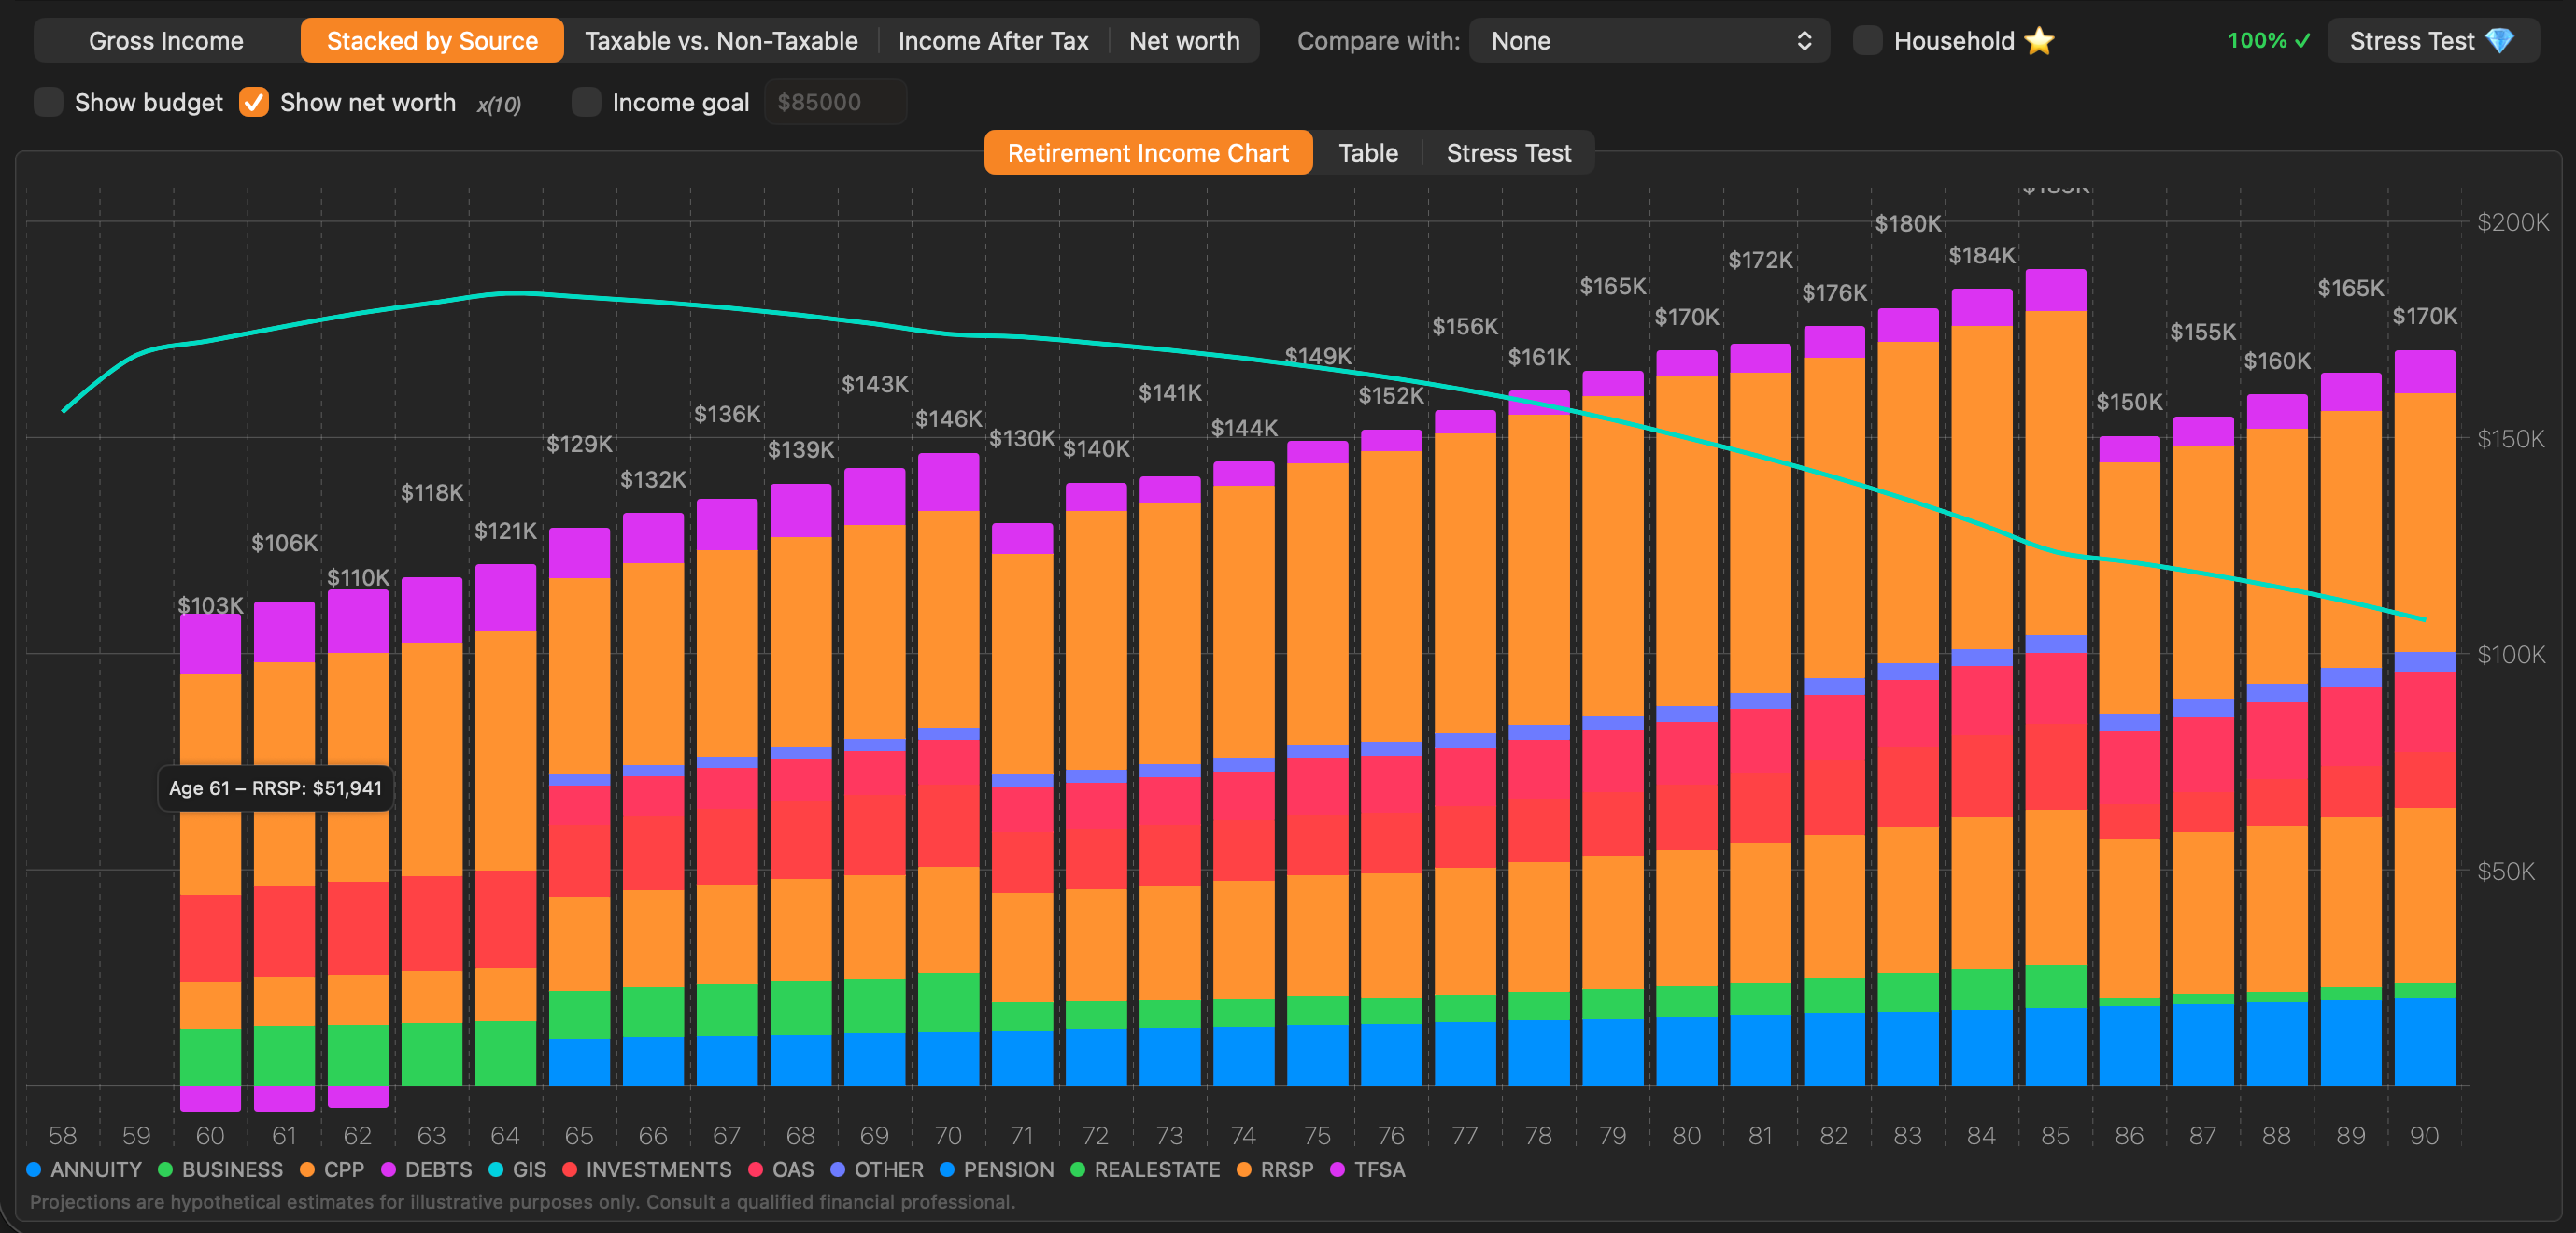
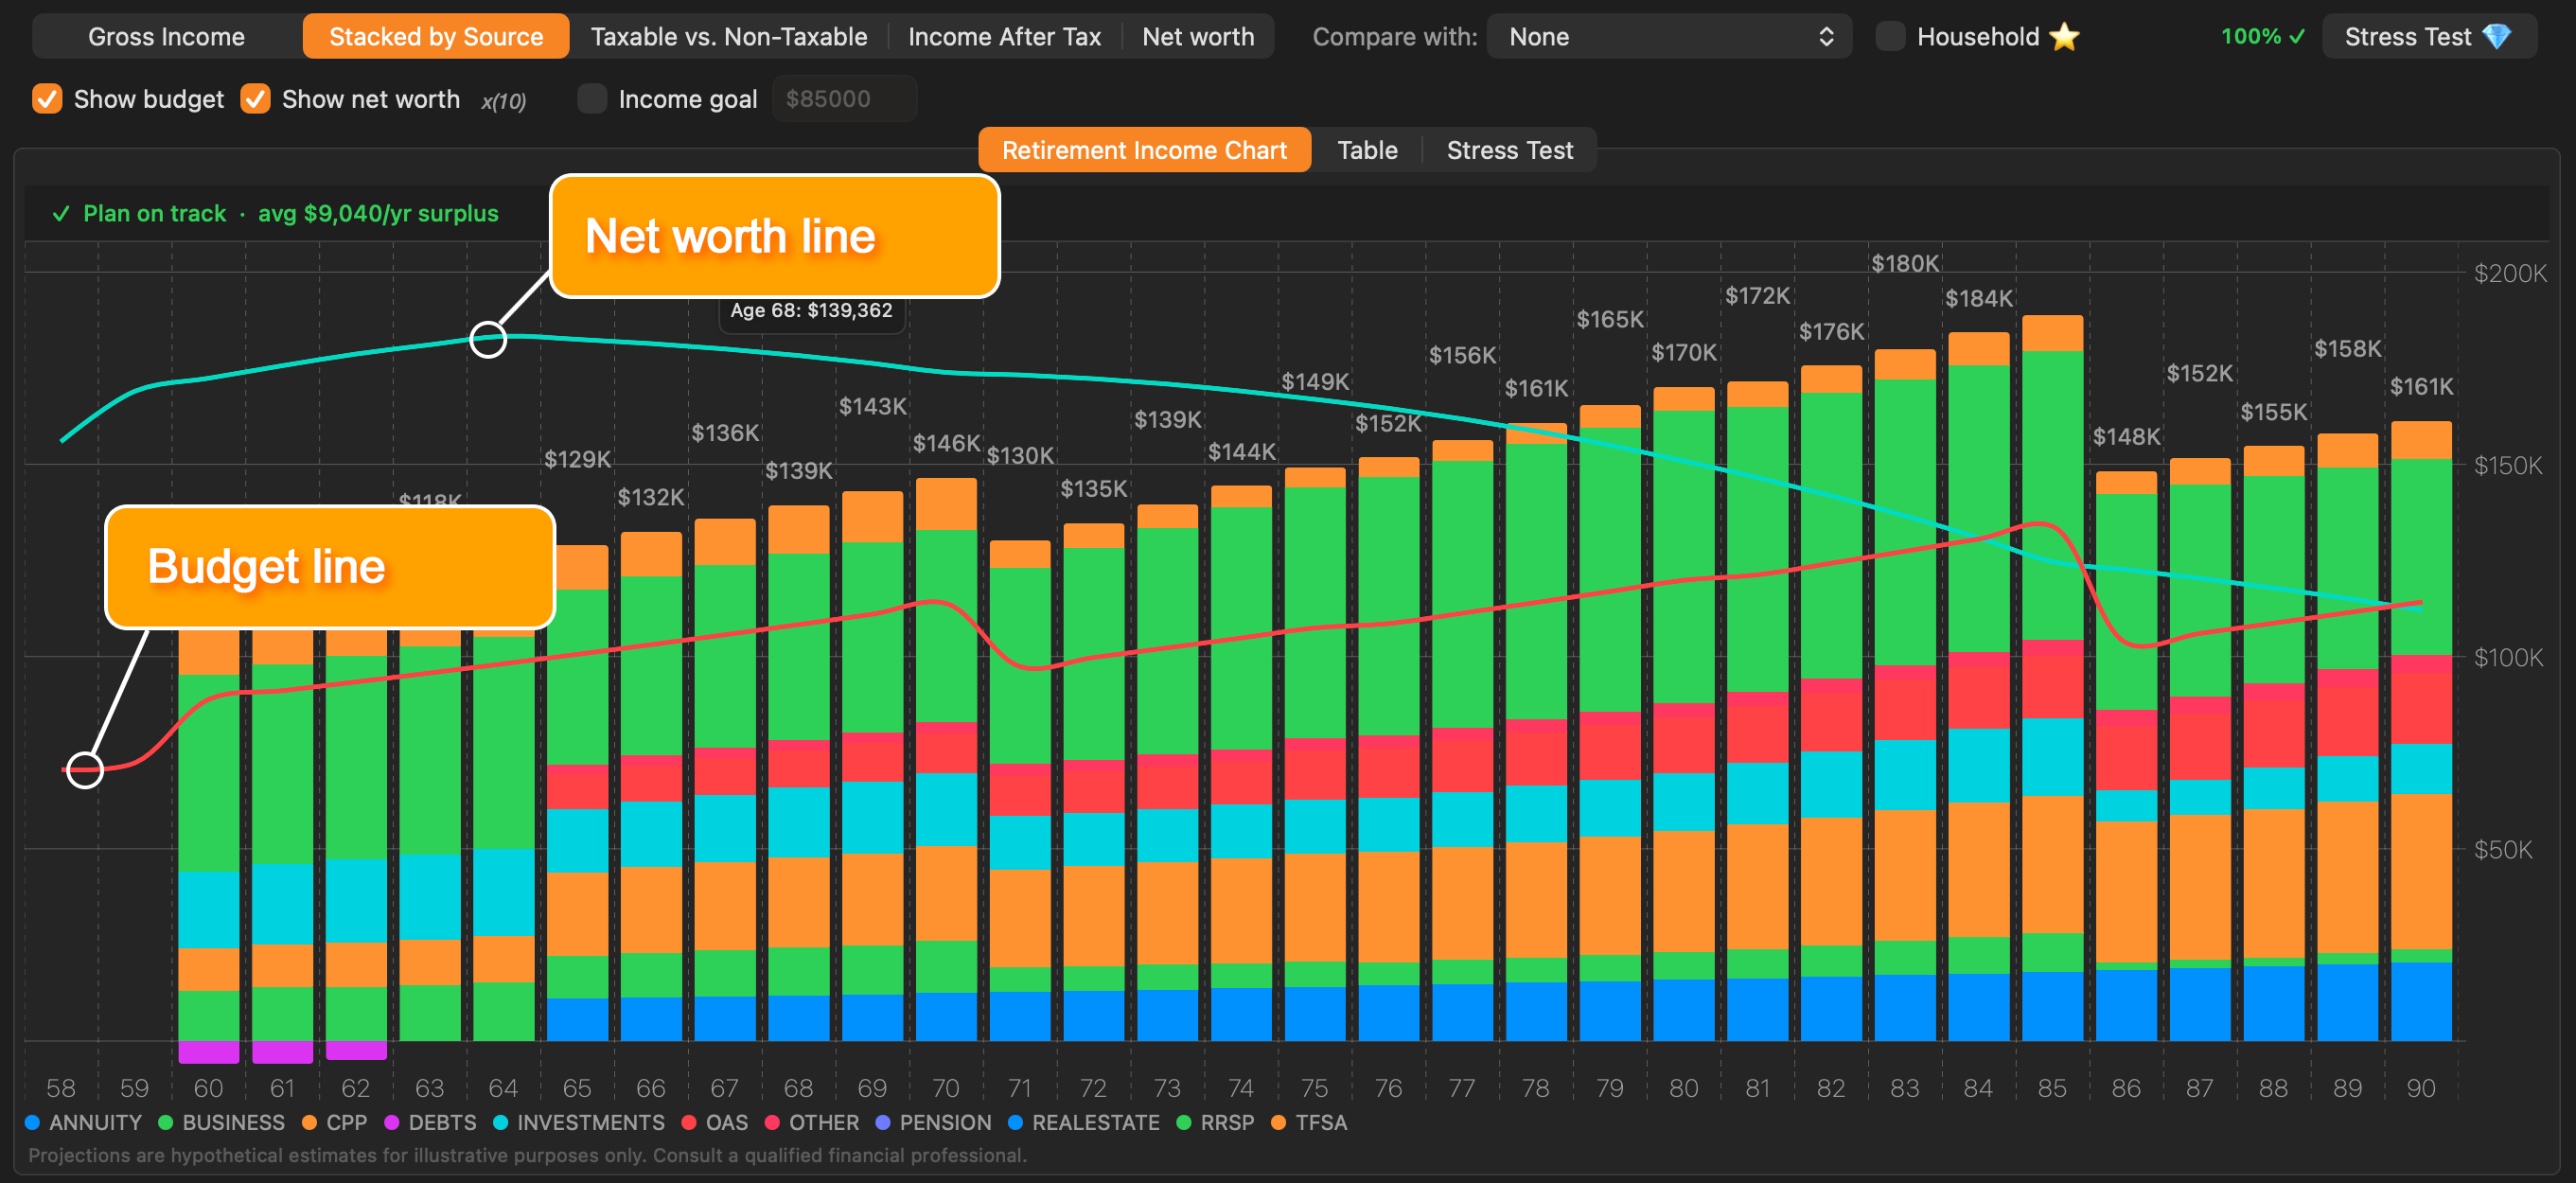
Stacked by Source — each income source colour-coded per year.
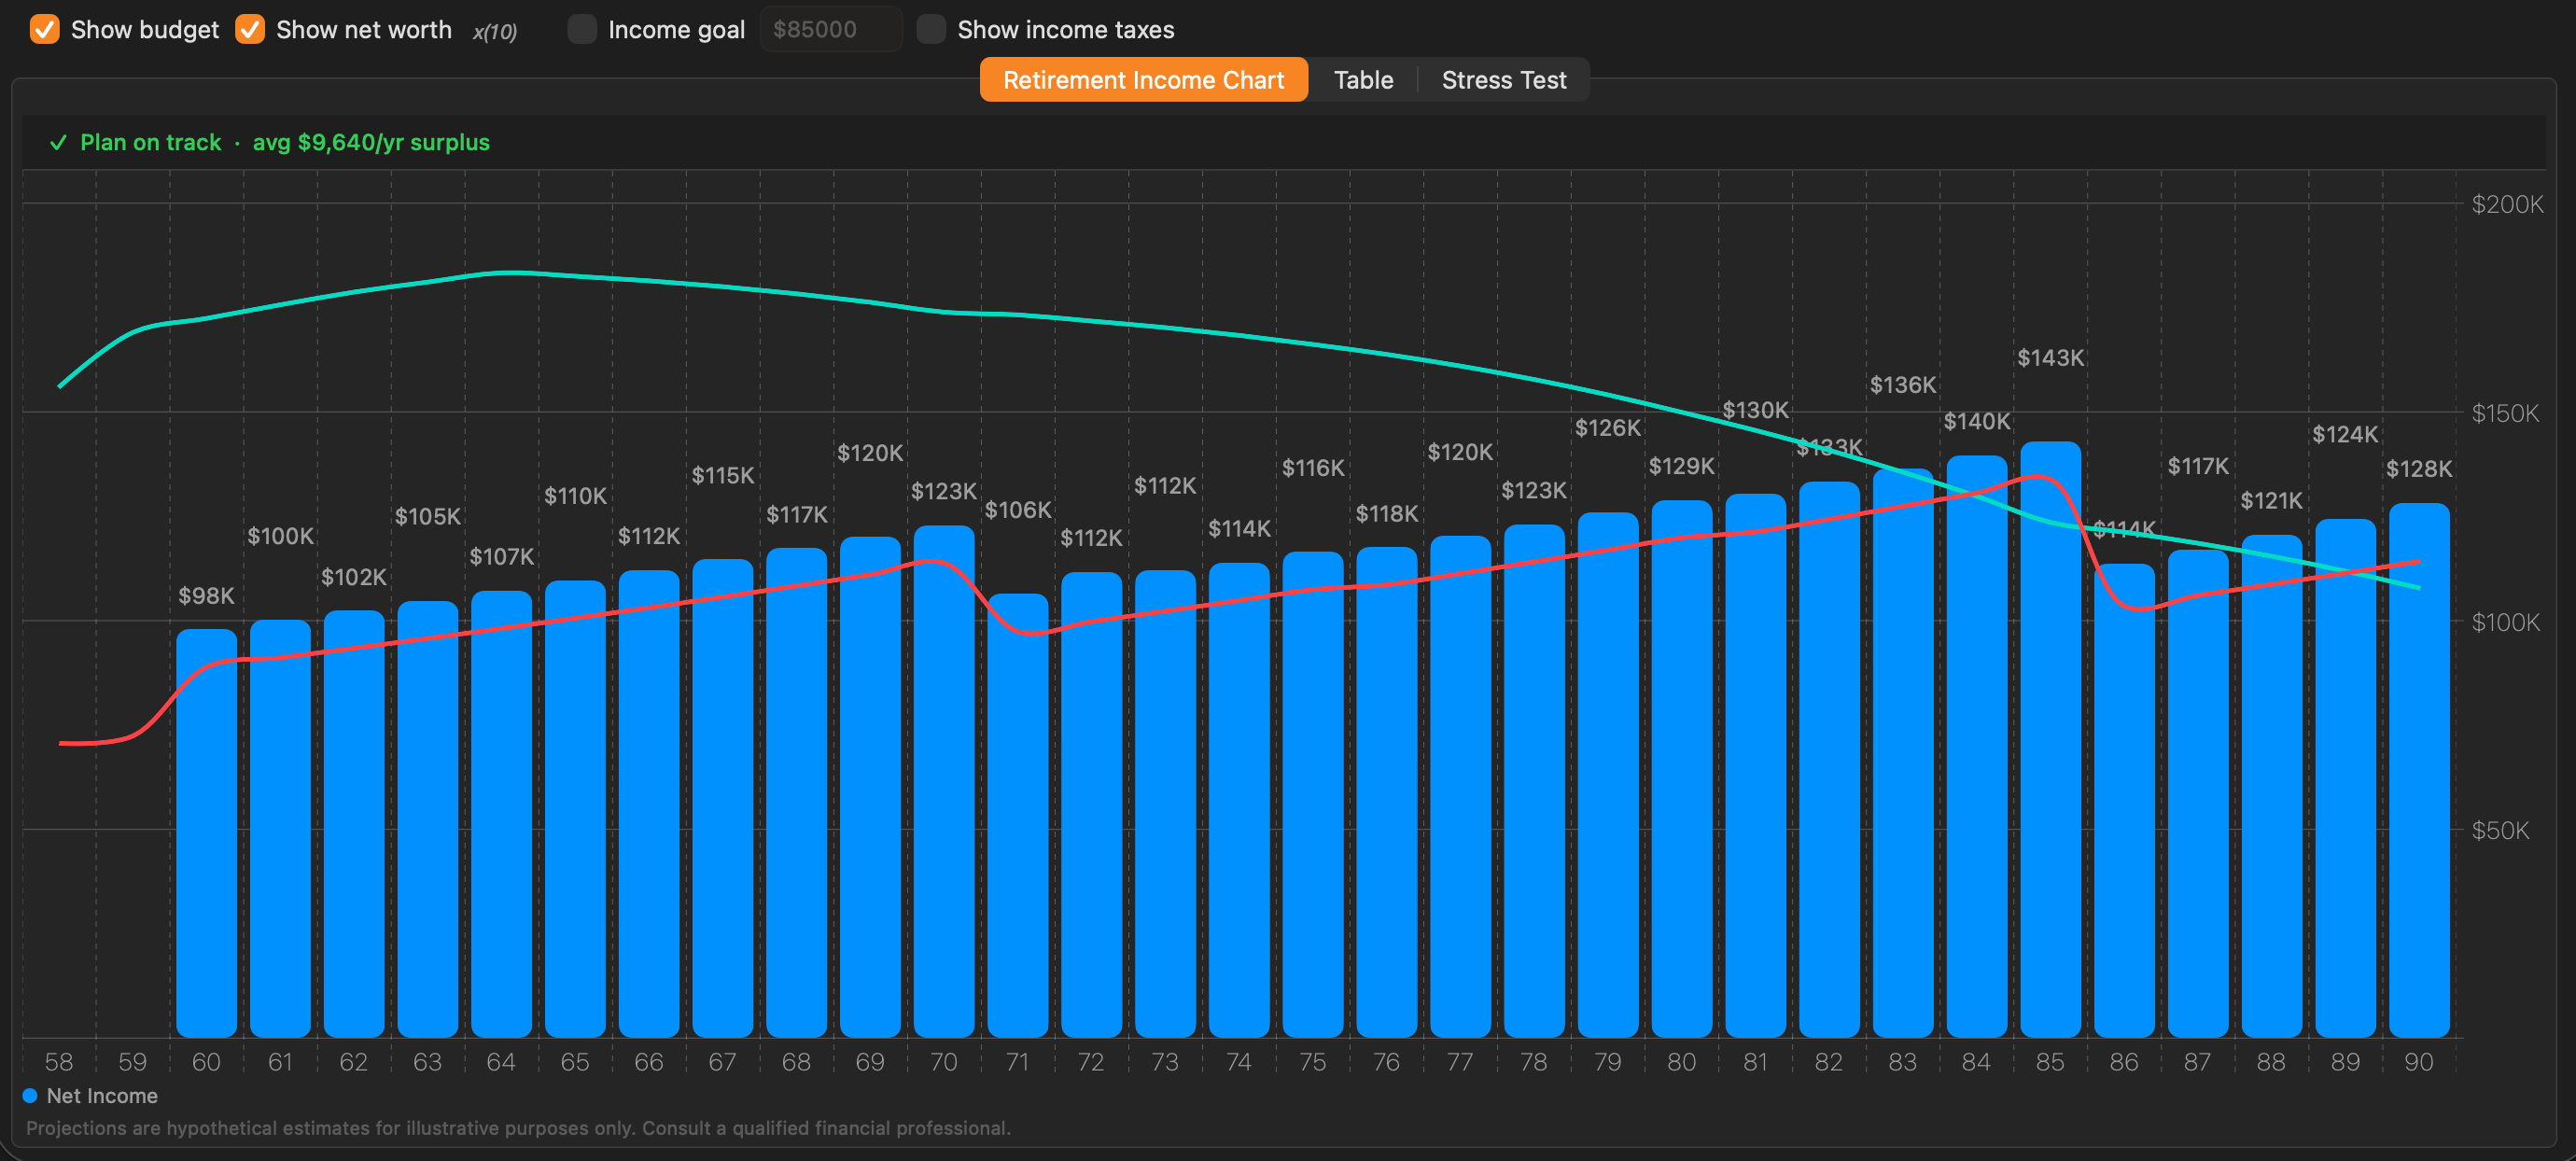
Income After Tax — real spending power after CRA's share.
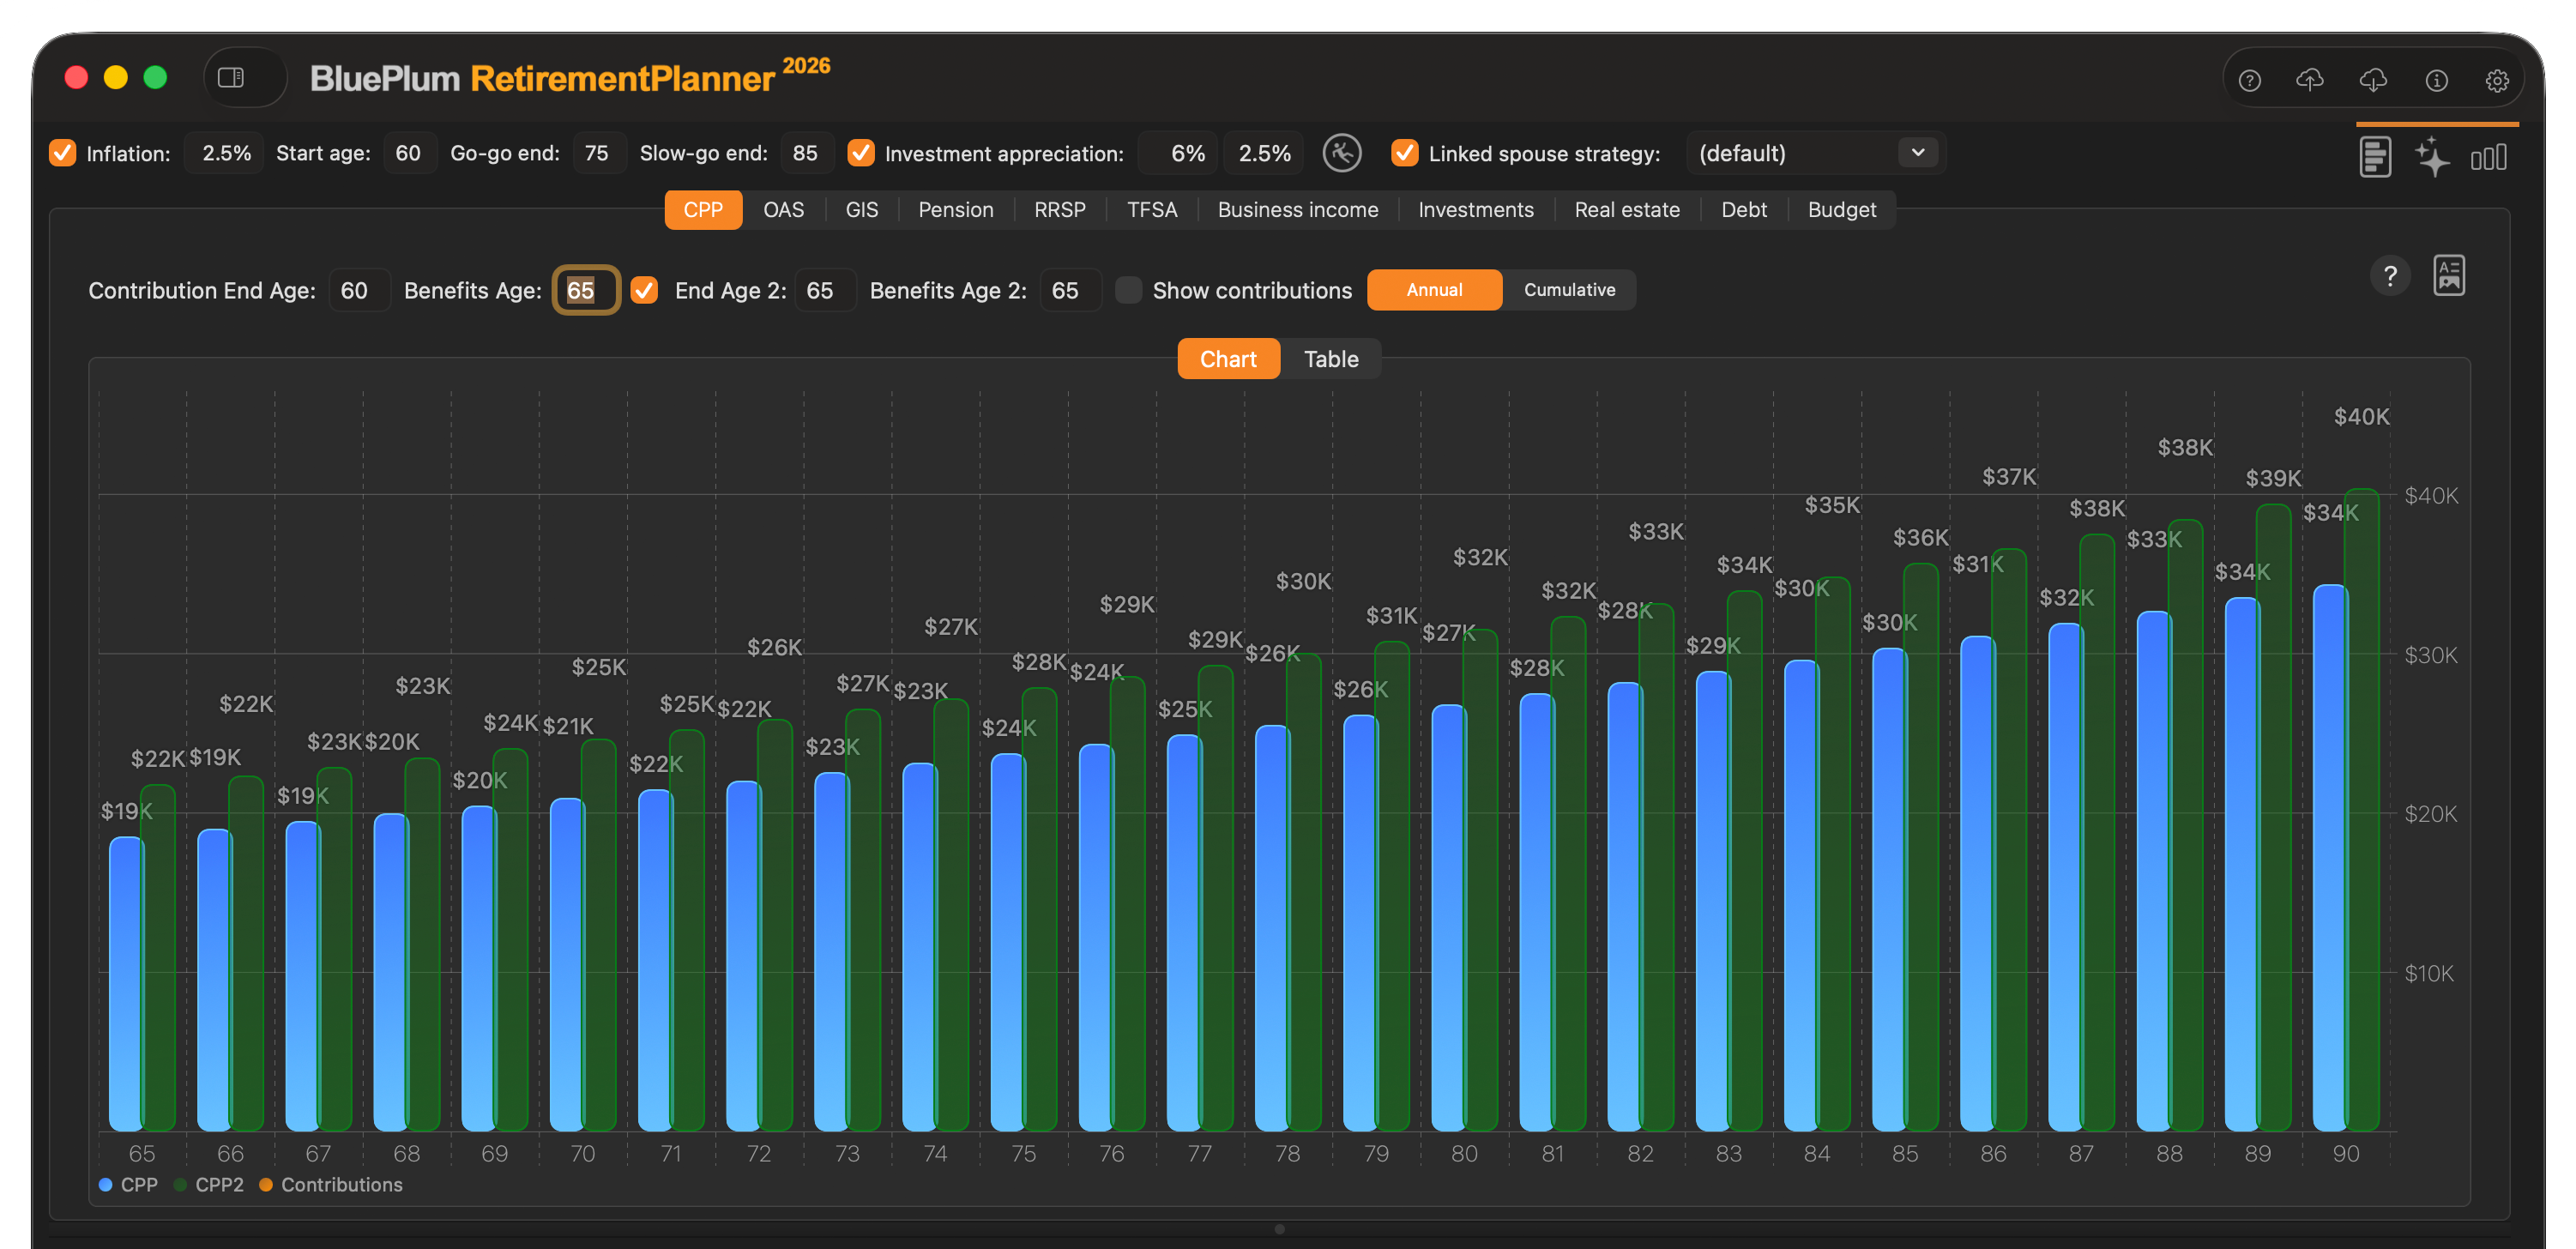
CPP tab — start age comparison and detailed contribution record.
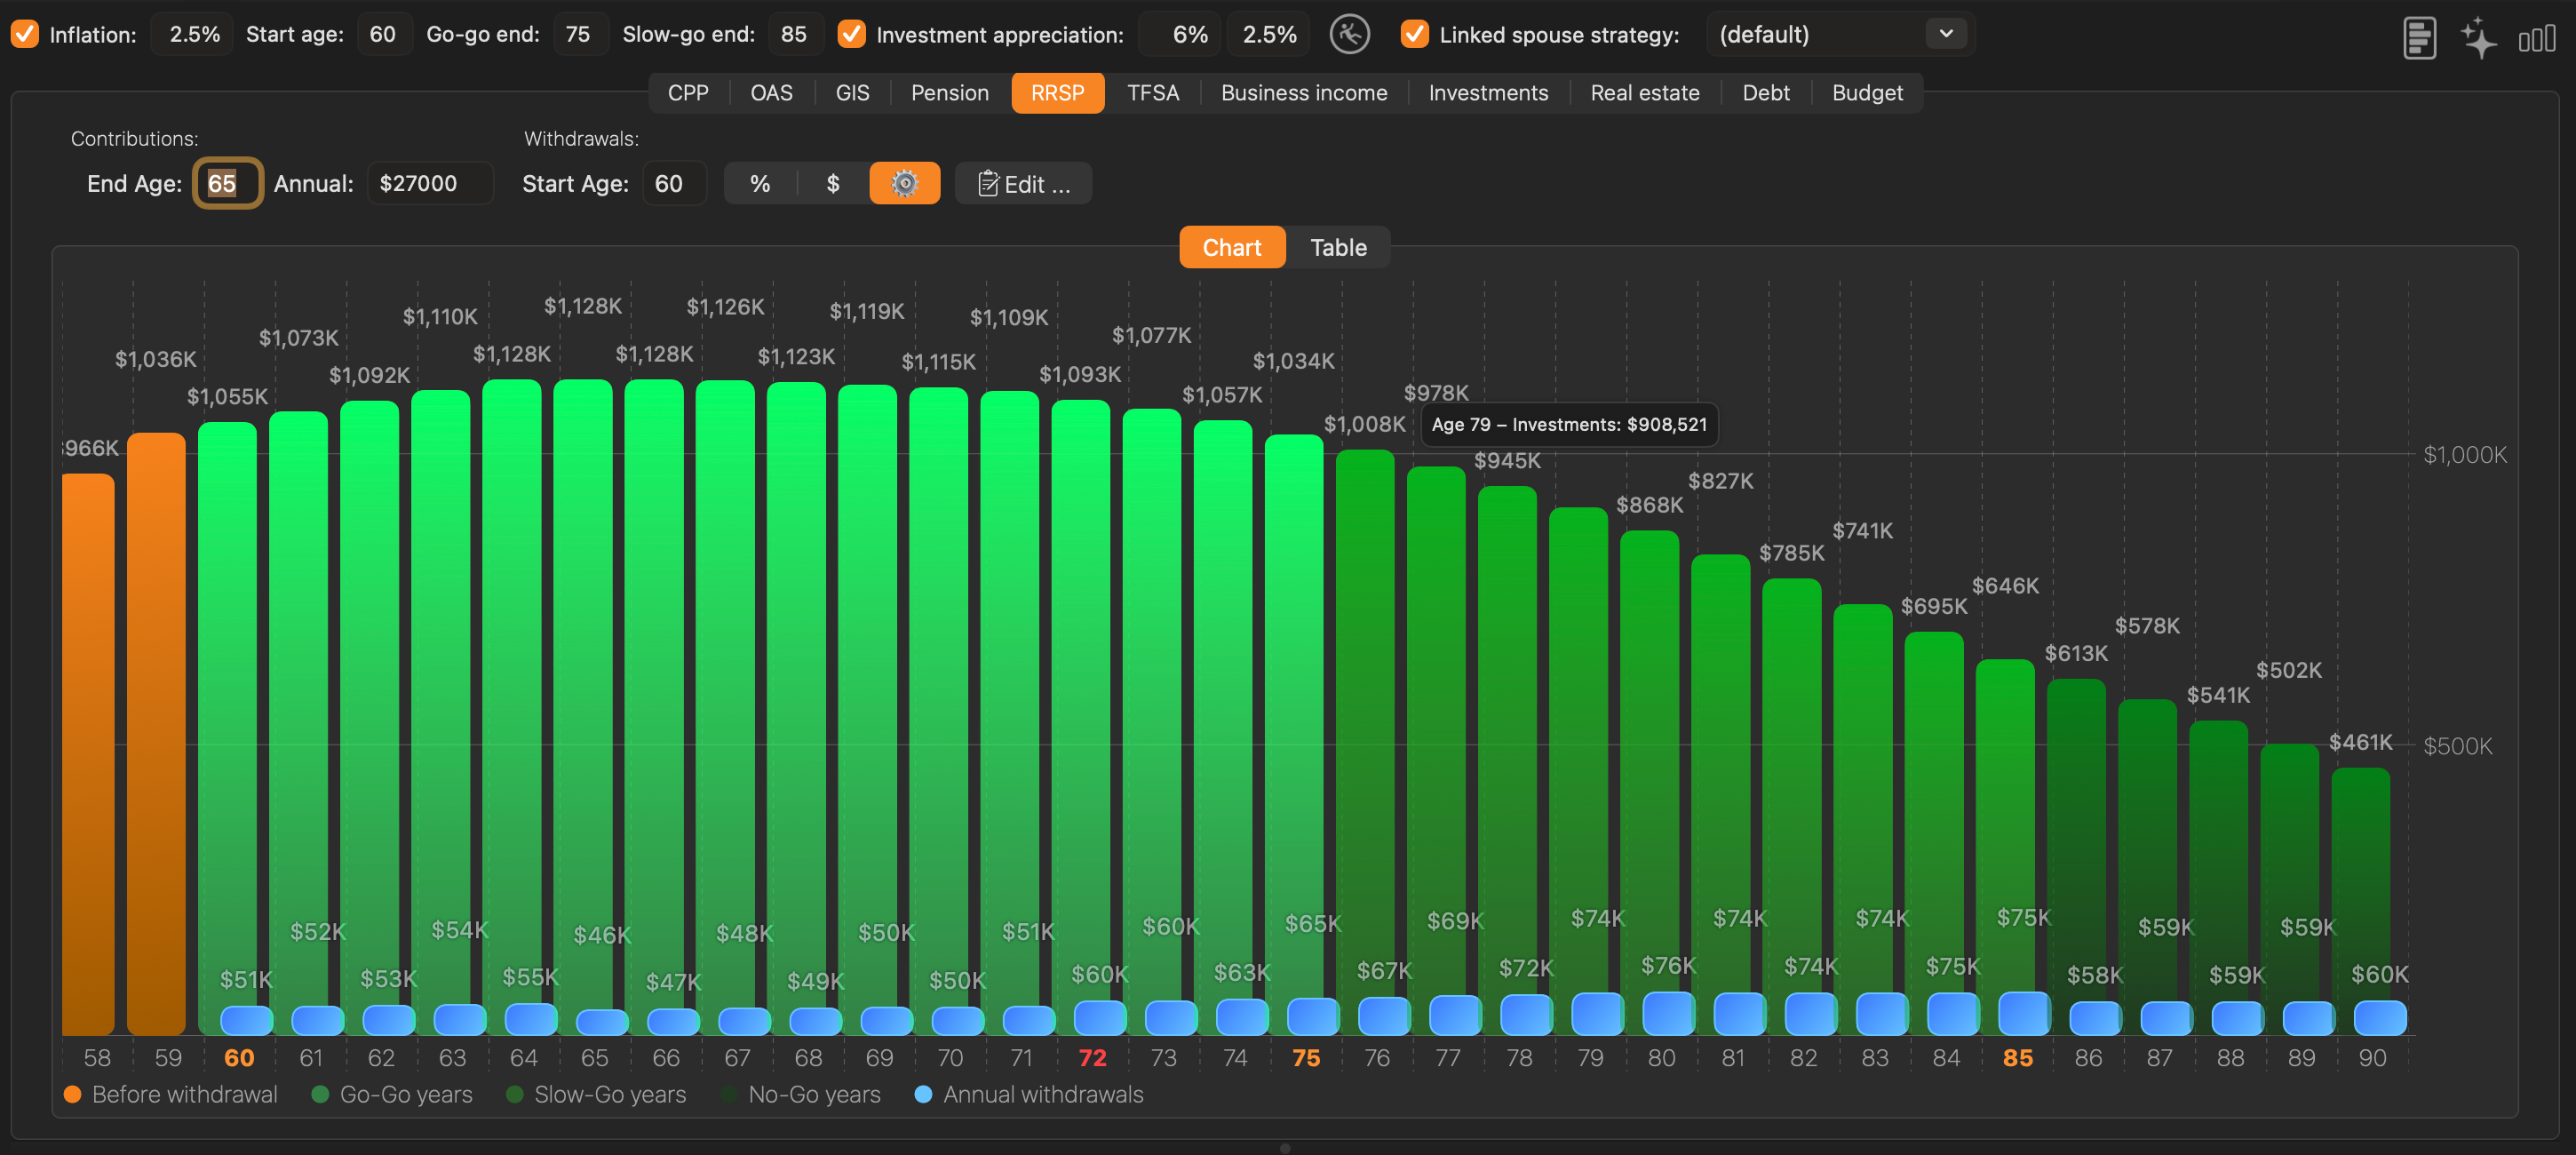
RRSP/RRIF tab — three-phase withdrawals with balance projection.
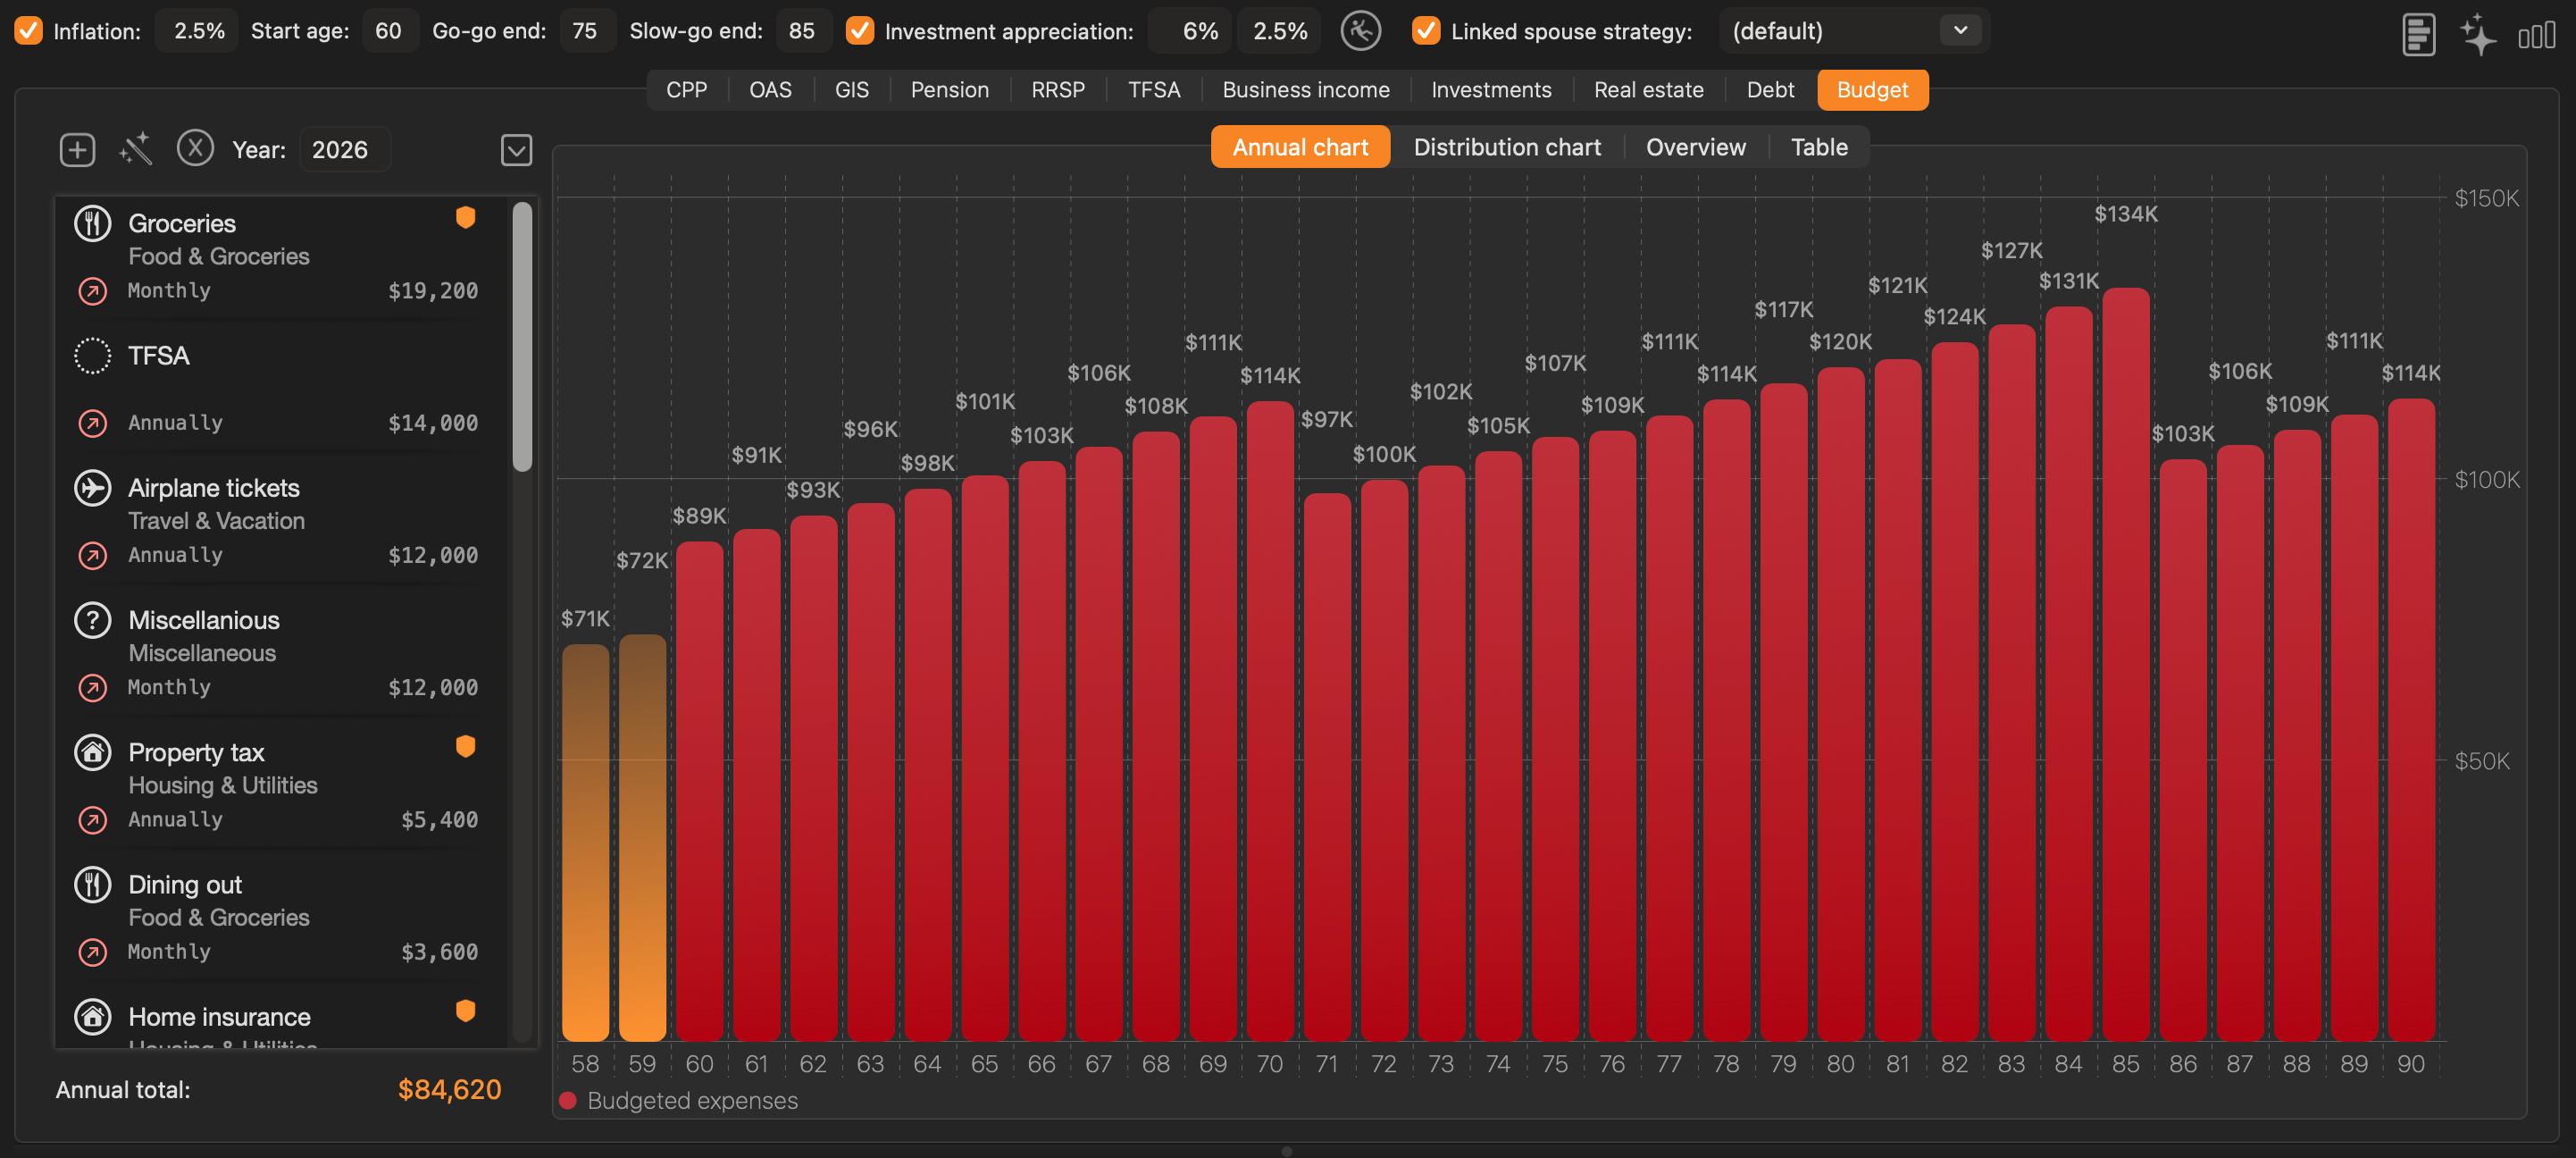
Budget tab — Go-Go / Slow-Go / No-Go phase spending model.
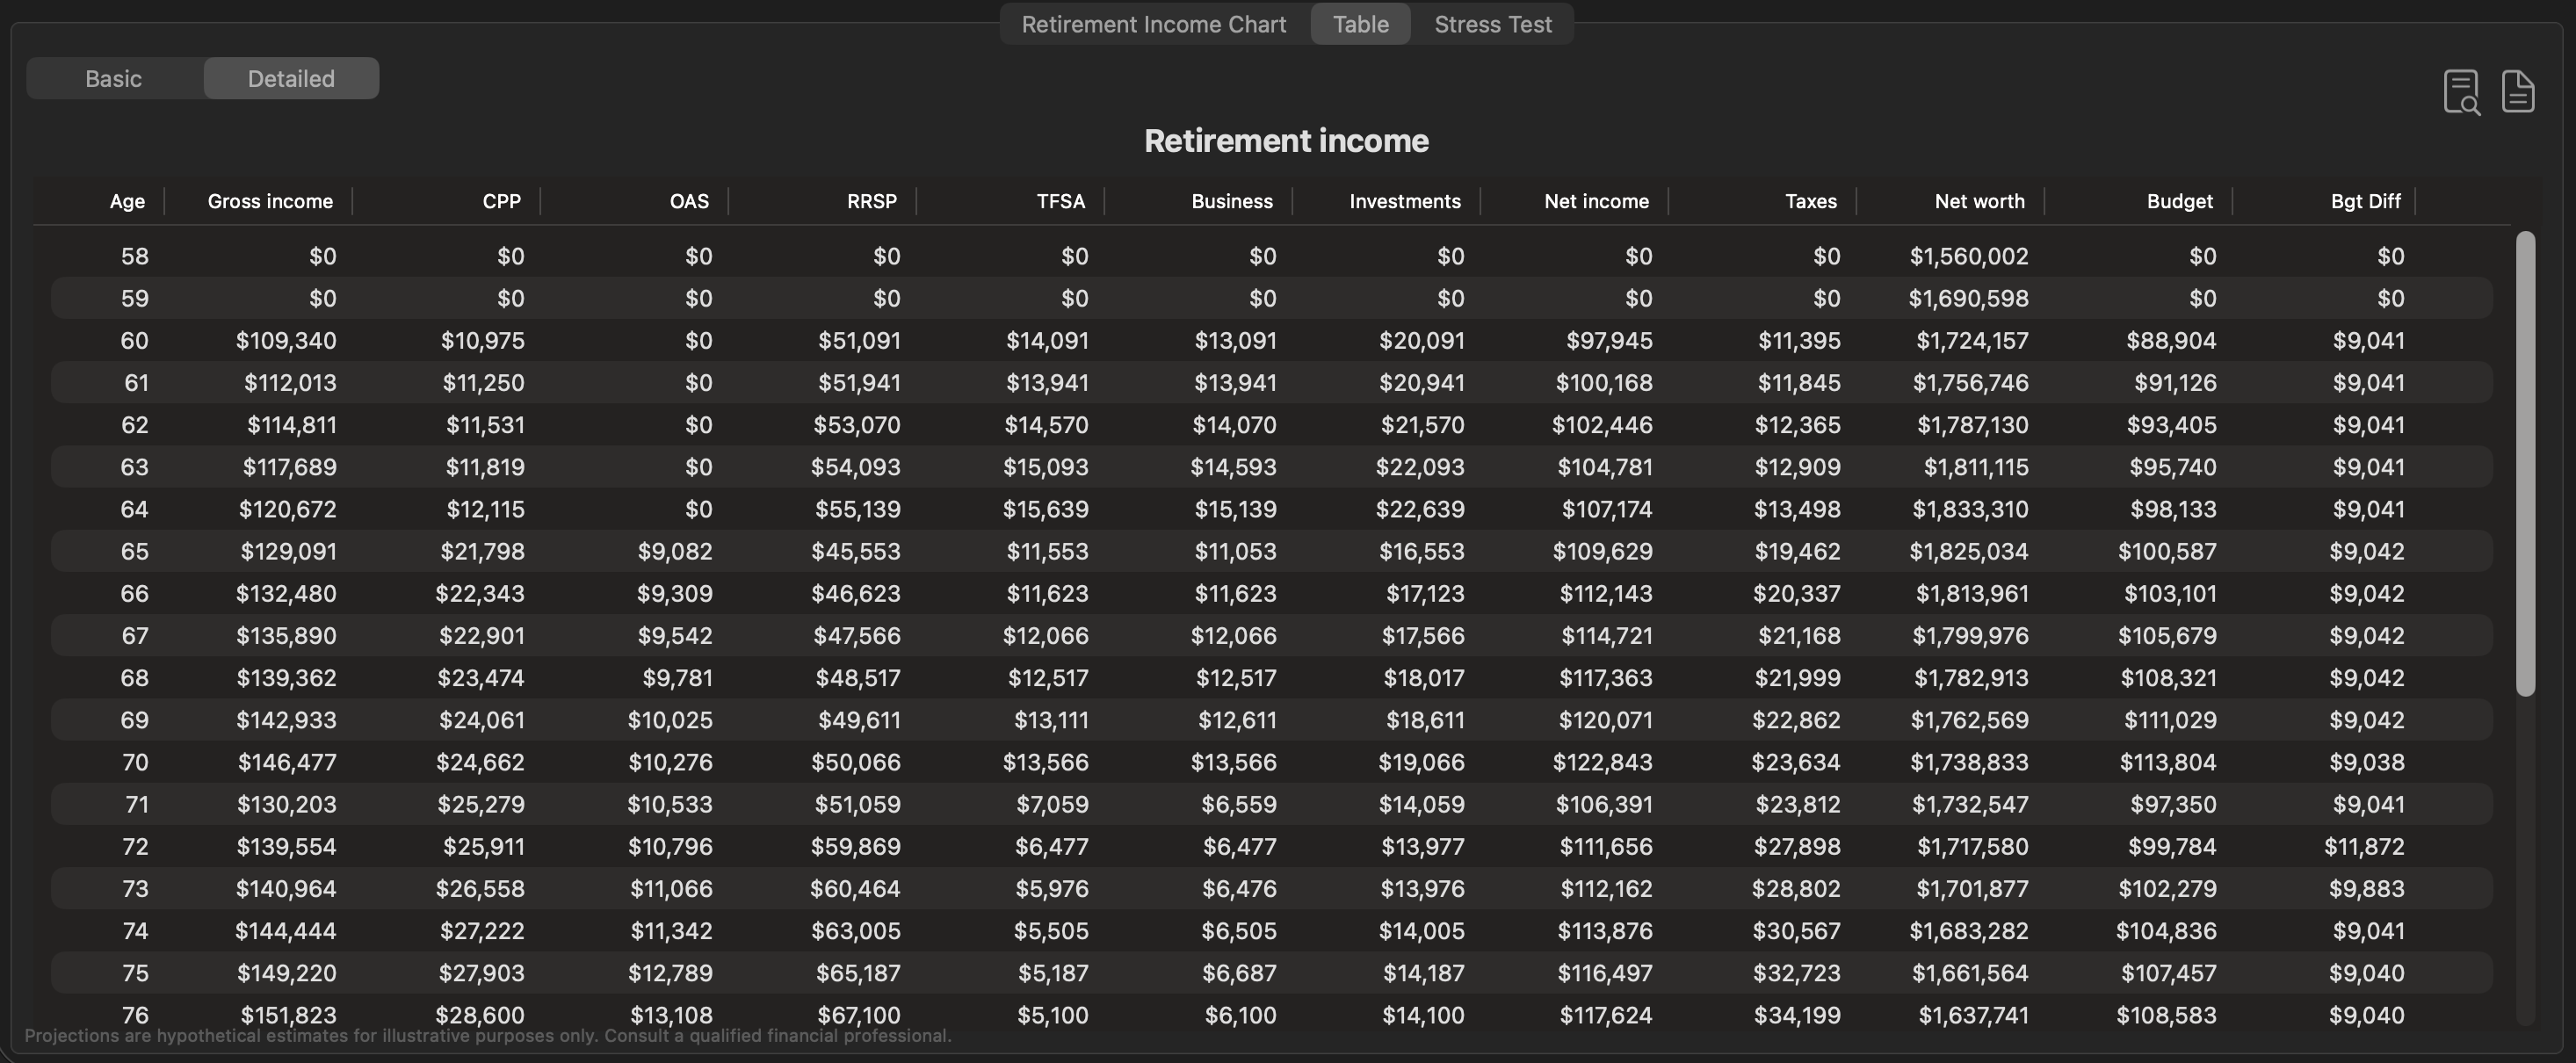
Table view — year-by-year data with CSV export.
About Blue Plum Software Inc.
Blue Plum Software Inc. is an independent software developer focused on building high-quality productivity and financial tools for macOS. Retirement Planner is the company's flagship product for the Canadian retirement planning market. For more information, visit theblueplum.com.
This press release contains forward-looking statements about product features and pricing. All details are subject to change prior to or following launch. Retirement Planner is a modelling tool and does not constitute financial, tax, or investment advice.
###
Quick Facts
Income Sources Covered
- Canada Pension Plan (CPP + CPP2)
- Old Age Security (OAS)
- Guaranteed Income Supplement (GIS)
- RRSP / RRIF
- TFSA
- Pension / Annuity (DB)
- Business Income
- Non-Registered Investments
- Real Estate
- Debt
Media Assets Available
- App icon — 1024 × 1024 px PNG
- Full-resolution screenshots (all views)
- Sample client PDF report
- App Store badge (SVG & PNG)
- One-page media fact sheet
Contact us to request the full press kit as a download.